The price of an asset stays still when buyers and sellers are at an equilibrium. When this point of balance happens, it doesn’t last for very long. Buyers may overwhelm sellers and tip prices toward the upside, or vice versa. Such “imbalances” can also result in a see-saw type of motion, where the price goes up and down in a volatile motion.
Is there a way to get a clearer picture of the balance between buyers and sellers to avoid getting “faked out” of a long or short position? One indicator designed to analyze this aspect of price action is called Balance of Power.
What is the Balance of Power (BOP) Indicator?
Balance of Power, introduced by Igor Levshin in August 2001, is a price-based indicator used to evaluate the overall strength of buyers and sellers in the market.
In simple terms, the indicator compares the power of buyers to push prices to higher extremes with the power of sellers to move prices to lower extremes.
The formula for calculating the BOP is as follows:
Balance of Power = (Close price – Open price) / (High Price – Low price)
The indicator oscillates between -1 & +1. When the indicator is positive the bulls are in charge, and when the indicator is negative the sellers are dominating. When the indicator is close to 0 it indicates that buyers and sellers are in equilibrium.
How to Use Balance of Power
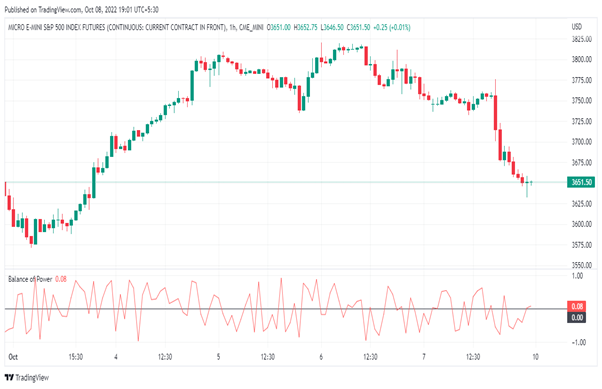
Figure 1.1 Micro E-Mini S&P Index Futures Hourly Chart October 2022 & Balance of Power in the bottom panel.
Using the raw daily figures makes it difficult to interpret the indicator as observed in Figure 1.1 above, so Levshin recommends smoothing the daily values using the 14-period SMA (keep in mind that the number of periods can be modified by the trader according to the timeframe being used). In other words, you can customize the values according to your preferred trading timeframe.
In Figure 1.2 below the BOP daily values are smoothed using 9-period SMA. A trader can consider buying when the indicator crosses above the zero line and selling when the indicator crosses below the zero line.
- At points 1 & 2 the BOP gave a timely sell signal but gave a late exit, giving back most of the move.
- At point 3 the BOP gave a timely buy & sell signal capturing most part of the uptrend.
- Point 4 is another good example of how the BOP gives an early sell signal.
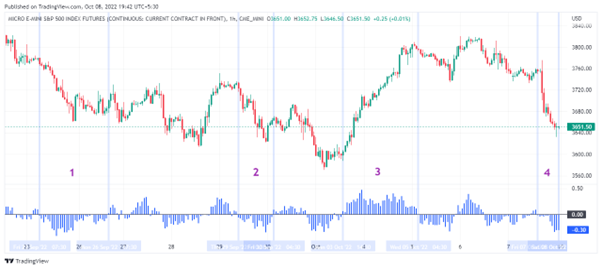
Figure 1.2 Micro E-Mini S&P Index Futures Hourly Chart 22nd September 2022 to 8th October 2022 & Smoothed Balance of Power using 9 period SMA in the bottom panel.
However, there are other areas where the indicator signaled false crossovers, causing a lot of whipsaws. One way to reduce the number of whipsaws is to increase the number of periods in the SMA, but it would also reduce the responsiveness of the indicator.
There is always a tradeoff between reliability and frequency. If the number of periods in the SMA are increased then there would be fewer trades but more reliable and if the number of periods is decreased then there would be more trades but less reliable.
The BOP indicator can also be used to identify price divergences. Notice in Figure 1.3 below that on 1st October the price is making a new low but the BOP is not making a new low, indicating a positive divergence. On 6th October price made a new high but BOP didn’t, indicating a negative divergence.
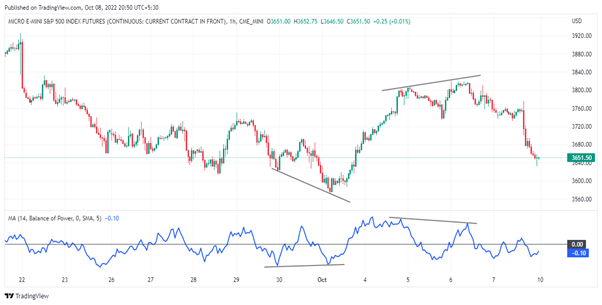
Figure 1.3 Micro E-Mini S&P Index Futures Hourly Chart 22nd September 2022 to 8th October 2022 & Smoothed Balance of Power using 9 period SMA in the bottom panel.
As with all indicators, traders should use the Balance of Power indicator in conjunction with other indicators and technical analysis. A trader can always test the indicator first before putting it to use in real trading.
The Bottom Line
Because the Balance of Power settings can be modified with regard to responsiveness, some traders prefer not to use it as a standalone indicator but in addition to strict “price action” based methods. This means paying attention to the progression of swing high and swing low levels in addition to any chart patterns that can be seen. Before you use BOP, take some time to experiment with the settings as there’s a tradeoff between the frequency of trades (responsiveness of the indicator) and reliability toward indicating shifts in momentum and balance. Finding the right “balance,” so to speak, between reliability and frequency can help make this tool more suitable for your style of trading.
Please be aware that the content of this blog is based upon the opinions and research of GFF Brokers and its staff and should not be treated as trade recommendations. There is a substantial risk of loss in trading futures, options and forex. Past performance is not necessarily indicative of future results.
Disclaimer Regarding Hypothetical Performance Results: HYPOTHETICAL PERFORMANCE RESULTS HAVE MANY INHERENT LIMITATIONS, SOME OF WHICH ARE DESCRIBED BELOW. NO REPRESENTATION IS BEING MADE THAT ANY ACCOUNT WILL OR IS LIKELY TO ACHIEVE PROFITS OR LOSSES SIMILAR TO THOSE SHOWN. IN FACT, THERE ARE FREQUENTLY SHARP DIFFERENCES BETWEEN HYPOTHETICAL PERFORMANCE RESULTS AND THE ACTUAL RESULTS SUBSEQUENTLY ACHIEVED BY ANY PARTICULAR TRADING PROGRAM.
ONE OF THE LIMITATIONS OF HYPOTHETICAL PERFORMANCE RESULTS IS THAT THEY ARE GENERALLY PREPARED WITH THE BENEFIT OF HINDSIGHT. IN ADDITION, HYPOTHETICAL TRADING DOES NOT INVOLVE FINANCIAL RISK, AND NO HYPOTHETICAL TRADING RECORD CAN COMPLETELY ACCOUNT FOR THE IMPACT OF FINANCIAL RISK IN ACTUAL TRADING. FOR EXAMPLE, THE ABILITY TO WITHSTAND LOSSES OR TO ADHERE TO A PARTICULAR TRADING PROGRAM IN SPITE OF TRADING LOSSES ARE MATERIAL POINTS WHICH CAN ALSO ADVERSELY AFFECT ACTUAL TRADING RESULTS. THERE ARE NUMEROUS OTHER FACTORS RELATED TO THE MARKETS IN GENERAL OR TO THE IMPLEMENTATION OF ANY SPECIFIC TRADING PROGRAM WHICH CANNOT BE FULLY ACCOUNTED FOR IN THE PREPARATION OF HYPOTHETICAL PERFORMANCE RESULTS AND ALL OF WHICH CAN ADVERSELY AFFECT ACTUAL TRADING RESULTS.