The price of Brent crude is heading towards a three-month high, climbing above $83 a barrel, according to Bank of America’s global commodity research team. Despite economic factors that have held the price within a trading band of $70 to $90 for most of the year, these analysts predict a rally to the top of this range.
Why does this matter?
The oil market is expected to significantly tighten over the next 18 months due to a combination of factors including reduced output from OPEC and lower exports from Russia. In addition, the U.S. strategic petroleum reserve needs to be refilled, adding further pressure. The anticipated rise in oil prices could re-ignite inflationary pressures, causing an upset in the global economy and potentially leading to unexpected rate hikes.
How might Brent’s prices affect WTI crude oil prices (CL)?
Brent Crude and West Texas Intermediate (e.g. CL futures contracts) are like the two big names in the world of oil. Even though their prices usually correlate, sometimes they don’t. This can happen because of different things (supply chain-wise or politically) happening in the areas where the oil comes from.
But if you trade CL, you should keep an eye on the price of Brent because what happens to Brent’s price will likely follow in CL prices (and vice versa).
What’s the big picture?
With Brent crude projected to reach $90 a barrel by early 2024, a substantial shift in oil market dynamics is expected. The coming months will be critical in observing how inflation and oil price trends unfold, and the impact they could have on interest rates and broader economic conditions.
Is this a tradable scenario?
It may be tradable for both day and swing traders, mainly due to the volatility and trends implied.
With Brent crude prices predicted to rally to $90.00 a barrel, short-term traders could benefit from the price movement as it trends and fluctuates towards the target price. Plus, the expectation that the oil market will tighten over the next 18 months due to reduced output from OPEC, lower exports from Russia, and the need for the U.S. to refill its strategic petroleum reserve could lead to higher volatility. And both day and swing traders thrive on such volatility.
The technical picture
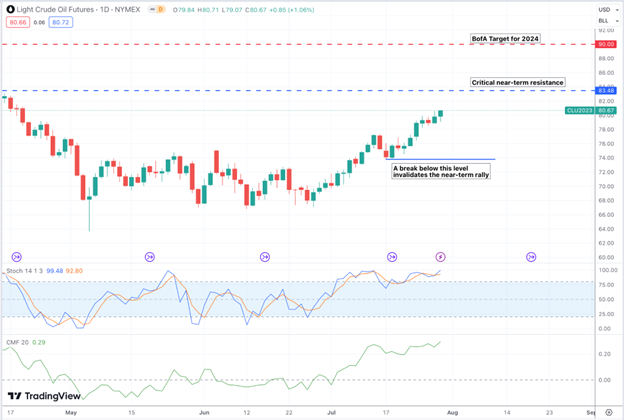
Crude Oil (CL) – Daily – April 14 – July 28
Bank of America’s price target is illustrated by the red line. For CL to reach that price, it would have to break above historical resistance at the 83.50 level.
Watch out for a possible pullback, as CL is well within “overbought” territory, according to the Stochastic Oscillator. On the other hand, overbought readings can persist for extended periods in stochastics before pulling back.
The Chaikin Money Flow also shows strong buying pressure. This adds to the case that CL may continue to rally up to or through the 83.50 level.
On the downside, should CL pull back, it must stay above 74.00 (the most recent swing low) or else the near-term rally may no longer be valid.
The bottom line
In a nutshell, Brent crude is on an upward march, hitting a three-month high and projected to keep rising, potentially to $90 a barrel by early 2024. Factors like OPEC’s reduced output, lower Russian exports, and a U.S. petroleum reserve in need of refill could trigger a hike in oil prices, reigniting inflation, and maybe even springing unexpected rate hikes. In short, keep a sharp eye on oil in the coming weeks to months. And of course, monitor the global fundamentals, especially if you want to be on the right side of volatility.
Please be aware that the content of this blog is based upon the opinions and research of GFF Brokers and its staff and should not be treated as trade recommendations. There is a substantial risk of loss in trading futures, options and forex. Past performance is not necessarily indicative of future results.
Disclaimer Regarding Hypothetical Performance Results: HYPOTHETICAL PERFORMANCE RESULTS HAVE MANY INHERENT LIMITATIONS, SOME OF WHICH ARE DESCRIBED BELOW. NO REPRESENTATION IS BEING MADE THAT ANY ACCOUNT WILL OR IS LIKELY TO ACHIEVE PROFITS OR LOSSES SIMILAR TO THOSE SHOWN. IN FACT, THERE ARE FREQUENTLY SHARP DIFFERENCES BETWEEN HYPOTHETICAL PERFORMANCE RESULTS AND THE ACTUAL RESULTS SUBSEQUENTLY ACHIEVED BY ANY PARTICULAR TRADING PROGRAM.
ONE OF THE LIMITATIONS OF HYPOTHETICAL PERFORMANCE RESULTS IS THAT THEY ARE GENERALLY PREPARED WITH THE BENEFIT OF HINDSIGHT. IN ADDITION, HYPOTHETICAL TRADING DOES NOT INVOLVE FINANCIAL RISK, AND NO HYPOTHETICAL TRADING RECORD CAN COMPLETELY ACCOUNT FOR THE IMPACT OF FINANCIAL RISK IN ACTUAL TRADING. FOR EXAMPLE, THE ABILITY TO WITHSTAND LOSSES OR TO ADHERE TO A PARTICULAR TRADING PROGRAM IN SPITE OF TRADING LOSSES ARE MATERIAL POINTS WHICH CAN ALSO ADVERSELY AFFECT ACTUAL TRADING RESULTS. THERE ARE NUMEROUS OTHER FACTORS RELATED TO THE MARKETS IN GENERAL OR TO THE IMPLEMENTATION OF ANY SPECIFIC TRADING PROGRAM WHICH CANNOT BE FULLY ACCOUNTED FOR IN THE PREPARATION OF HYPOTHETICAL PERFORMANCE RESULTS AND ALL OF WHICH CAN ADVERSELY AFFECT ACTUAL TRADING RESULTS.