Distinguishing an uptrend from a downtrend can be tricky for a couple of reasons. First, the idea of a “trend” always implies some kind of a “projection.” For instance, if we’re in an uptrend, then it follows that the market, moving upward, is likely to continue in that direction, whether in the near-term or longer-term. If you can’t predict future prices (as nobody can), then you can never be certain that your interpretation of the current trend is 100% accurate beyond a given time period.
But the most difficult aspect of identifying a trend is that multiple trends within trends exist. Are you looking at a major trend or any series of smaller trends?
Let’s take a look at the Dow Jones Industrial Average Futures (YM)
YM – Daily – December 2019 – September 2020
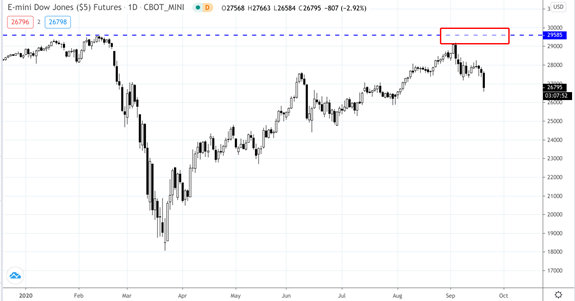
Some traders may argue that on a larger time frame, we can’t really say we’re trending upward until we break above pre-pandemic highs (see red rectangle highlighting February 2020 high).
After all, the definition of an uptrend is a series of higher highs and higher lows. We haven’t breached the March low, but neither have we broken above the February high. So, from a longer-term perspective, is the YM really in an uptrend, in a sideways range, or at the precipice of a top?
If we scale down, we get a different picture, one that emphasizes all of the rallies.
YM – Daily – March 6, 2020 – September 21, 2020
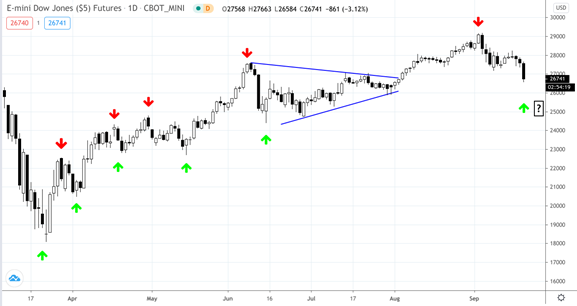
If you look at the series of green and red arrows above, you’ll notice that the lows represented by the green arrows are constantly moving higher. Likewise, the highs represented by the red arrows are also moving higher. In the middle, there’s a consolidation period forming a symmetrical triangle, which broke toward the upside. The recent dip on September 21 is nowhere near the last “swing low” in June. This gives us a clear picture confirming an uptrend.
But if you look at the smaller picture, we get a different reading. See the price action inside the rectangle below.
YM – Daily – March 6, 2020 – September 21, 2020
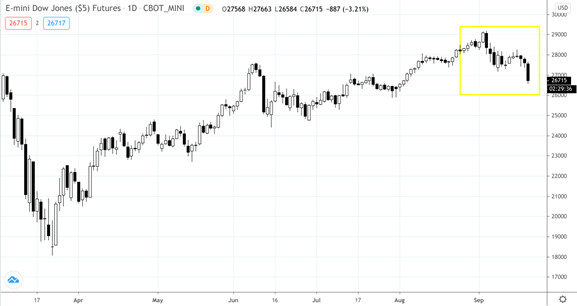
That shows us a potential downtrend? How so? Let’s blow it up and see.
YM – 1-Hour – August 17, 2020 – September 21, 2020
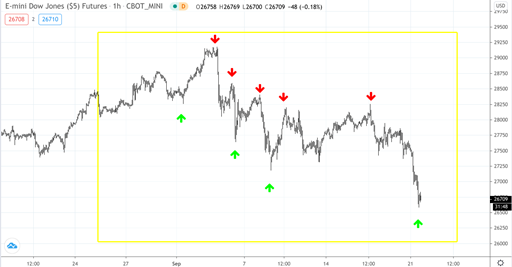
Notice the lower lows and lower highs? On a micro-trend scale, this is a confirmed downtrend. Might it be the beginning of an even larger decline?
Yet, those who rely on the 50-day and 200-day long-term indicators can still call the situation technically bullish, as shown below.
YM – Daily – March 6, 2020 – September 21, 2020
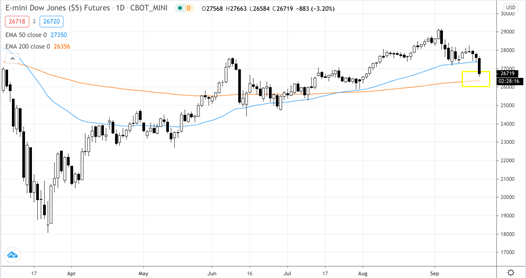
The 50-day crossed over the 200-day exponential moving average–a bullish sign–and the current price can decline to the 200-day EMA before the uptrend is considered under threat.
Yet for certain technical traders, the YM has a long way to go before the uptrend is in question.
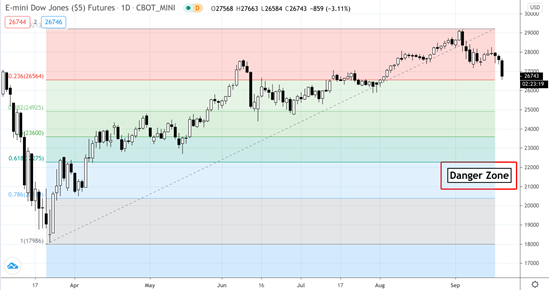
For those basing their trend readings on Fibonacci retracements, the uptrend is considered intact until it declines all the way down to between the 75% to 61.8% level, roughly between the price levels of 21,000 to 22,000.
The Bottom Line
So, is the market currently in an uptrend or downtrend? The truth is that we don’t know. Furthermore, trends–which are retrospective–tend to make poor predictors of the upcoming market environment. However, they are good for making “tactical” readings, especially when it comes to fine-tuning entry and exit points. If you need to make forecasts on potential market activity, then you’d be better off analyzing the impact monetary and fiscal policy (think COVID-19 stimulus package), sector rotation as a result of the pandemic, the impact of a weaker dollar, the current state of unemployment, and how all of this weighs against industrial production, income (is the current bump in income a result of fiscal spending?), consumer spending, and overall consumer sentiment (to name a few important indicators).
Please be aware that the content of this blog is based upon the opinions and research of GFF Brokers and its staff and should not be treated as trade recommendations. There is a substantial risk of loss in trading futures, options and forex. Past performance is not necessarily indicative of future results.
Disclaimer Regarding Hypothetical Performance Results: HYPOTHETICAL PERFORMANCE RESULTS HAVE MANY INHERENT LIMITATIONS, SOME OF WHICH ARE DESCRIBED BELOW. NO REPRESENTATION IS BEING MADE THAT ANY ACCOUNT WILL OR IS LIKELY TO ACHIEVE PROFITS OR LOSSES SIMILAR TO THOSE SHOWN. IN FACT, THERE ARE FREQUENTLY SHARP DIFFERENCES BETWEEN HYPOTHETICAL PERFORMANCE RESULTS AND THE ACTUAL RESULTS SUBSEQUENTLY ACHIEVED BY ANY PARTICULAR TRADING PROGRAM.
ONE OF THE LIMITATIONS OF HYPOTHETICAL PERFORMANCE RESULTS IS THAT THEY ARE GENERALLY PREPARED WITH THE BENEFIT OF HINDSIGHT. IN ADDITION, HYPOTHETICAL TRADING DOES NOT INVOLVE FINANCIAL RISK, AND NO HYPOTHETICAL TRADING RECORD CAN COMPLETELY ACCOUNT FOR THE IMPACT OF FINANCIAL RISK IN ACTUAL TRADING. FOR EXAMPLE, THE ABILITY TO WITHSTAND LOSSES OR TO ADHERE TO A PARTICULAR TRADING PROGRAM IN SPITE OF TRADING LOSSES ARE MATERIAL POINTS WHICH CAN ALSO ADVERSELY AFFECT ACTUAL TRADING RESULTS. THERE ARE NUMEROUS OTHER FACTORS RELATED TO THE MARKETS IN GENERAL OR TO THE IMPLEMENTATION OF ANY SPECIFIC TRADING PROGRAM WHICH CANNOT BE FULLY ACCOUNTED FOR IN THE PREPARATION OF HYPOTHETICAL PERFORMANCE RESULTS AND ALL OF WHICH CAN ADVERSELY AFFECT ACTUAL TRADING RESULTS.