Prices can move up and down in a wild volatile manner, so it is helpful to use a price map. Unless you’re accustomed to reading a chart, it’s easy to get lost in the immediate swing of things, unable to see the big picture. So, you’ll probably want to see the big picture, and the only way to do that is by looking at a price chart. A chart will show the price path that an asset has traveled. You can see all of the ups and downs leading to where it is now.
Don’t get distracted by the ups and downs. Instead, try to find the price levels at which strong buying and selling activity takes place. If you pay close attention, you’ll notice that buying and selling activity tends to recur at those very levels.
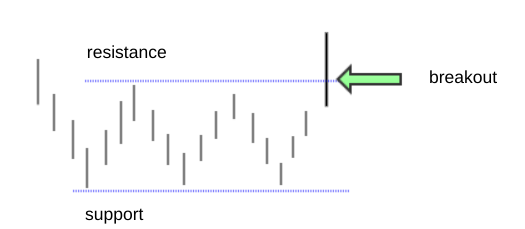
It’s called support and resistance, and it looks like this…
Support Shows You Where The Bulls Jumped In
Either an overwhelming number of buyers jumped in, or a few traders with lots of capital bought many shares (or lots or contracts) of an asset. Obviously, there was enough buying to drive prices upward.
For some reason, when an asset’s price falls back (or “dips”) to a support level, new buyers tend to enter the market or the previous buyers tend to buy more of it (they’re doing the BTFD thing). That’s the assumption, at least; that support is some kind of a “floor” for prices. If you look at price history, you’ll see that the practice of buying at support often tends to happen.
Remember: the stronger the historical support, meaning people have bought at a given support level more than once, or the level of buying caused a tremendous spike upward, the stronger the likelihood that price will rise, once again, at that support level.
Resistance Shows You Where The Bears Jumped In
Maybe a bunch of buyers decided to close their positions to take profit. Perhaps a bunch of short-sellers jumped in because they think that an asset is overvalued at a certain level. Either way, resistance is like a price “ceiling,” however temporary it may be.
Like support, the stronger the resistance level, the more likely it is to act like a ceiling from which price may bounce back down.
Buying At Support, And Buying More Above Resistance
If you think a bunch of buyers might jump in at a given support level, then that marks a good spot to jump in as well.
But beware of the scenario in which price breaks below support.
If it does, then many buyers who are “long” are likely to close out their positions. Short-sellers are likely to jump in and go short at that level as well. For the most part, you don’t want to be left holding a long position as it crashes to the next support level.
But, if you are long, and price breaks above resistance, then it’s likely that short-sellers may be forced to buy to close out their short position (what’s called a “short squeeze”). If you want to buy more of the asset, this is one favorable time to do it. It’s called a “breakout,” because price is breaking out of the proverbial roof, possibly toward another resistance level (or an all-time high).
The Takeaway
Support and resistance can help you identify favorable buy points and sell points on a price chart. Think of the chart as a map and support and resistance as critical entry and exit levels.
However, they don’t always pan out as planned. So, consider placing a stop loss below a support. You can always re-enter at a lower support level.
In short, support provides one answer to the question “how do I know if the price has dipped low enough to buy”.
In the coming weeks, we are going to continue with our blog series covering different BTFD strategies.
Please be aware that the content of this blog is based upon the opinions and research of GFF Brokers and its staff and should not be treated as trade recommendations. There is a substantial risk of loss in trading futures, options and forex. Past performance is not necessarily indicative of future results.
Be advised that there are instances in which stop losses may not trigger. In cases where the market is illiquid–either no buyers or no sellers–or in cases of electronic disruptions, stop losses can fail. And although stop losses can be considered a risk management (loss management) strategy, their function can never be completely guaranteed.