- The 5-8-13 Exponential Moving Average (EMA) combination is a favored tool among day traders, providing a responsive and precise insight into fast moving markets.
- By applying this EMA trio effectively along with other indicators, you can significantly refine your entry and exit points.
- Given the volatile nature of day trading, a meticulous and adaptive approach is critical when using this tool.
Day trading is a realm of split-second decisions, where success can hinge on the accuracy and timeliness of the information at a trader’s disposal. Within this dynamic environment, having an effective tool that offers both speed and precision becomes invaluable. Enter the 5-8-13 Exponential Moving Average (EMA) combination—a favorite among day traders.
Understanding the 5-8-13 EMA Configuration
The Exponential Moving Average (EMA) is a powerful tool in a trader’s arsenal. Unlike its counterpart, the Simple Moving Average (SMA), which attributes equal importance to all price data, the EMA emphasizes the most recent prices. As a result, the EMA becomes a fast-reacting instrument, perfectly tailored for the quick decisions that day trading demands.
So, why the numbers 5, 8, and 13? These are Fibonacci numbers, a sequence that frequently emerges in natural patterns and is deeply embedded in trading folklore for its seeming ubiquity in market trends. While there’s no scientific confirmation that Fibonacci numbers can anticipate price actions, their widespread use often turns them into self-fulfilling prophecies that can influence market dynamics (because many day traders may be using them).
Why Day Traders Use the 5-8-13 EMA
It’s Sensitive to Market Movements: With the 5-day EMA being hyper-sensitive to immediate price shifts, it offers day traders real-time insights, enabling them to act swiftly.
It Provides Some Layered Analysis: The 8-day and 13-day EMAs serve as intermediary and longer-term measures, respectively. Their combined insights provide a more holistic view of the market’s direction.
It Reduces Market Noise: One of the biggest challenges in day trading is the overwhelming volume of ‘noise’ or irrelevant data. The combined 5-8-13 EMA attempts to filter out this noise, helping traders focus on the essential cues.
How to Use the 5-8-13 EMA
- Prepare Your Chart: Begin by plotting the three EMAs (5, 8, and 13 periods) on your trading chart.
- Identify Momentum: A bullish trend might be brewing when the 5 EMA surges above the 8 and 13 EMAs. Conversely, a bearish inclination is suggested when the 5 EMA dives below its two counterparts.
- Add Another Indicator to Reinforce Your Trading Signal (optional): It’s wise not to rely solely on one metric. Reinforce EMA-based insights with other technical instruments like the Relative Strength Index (RSI) or the Stochastic Oscillator for a comprehensive reading.
- Decide On Your Exit Strategy: A common approach among day traders is to use the 5 EMA as a guide. Exiting a trade could be when the 5 EMA reverses its course, crossing the 8 EMA in the opposite direction to the initial trade.
As you can guess, the rules here are pretty loose, so it’s important to use sound judgment, experience, and ongoing market analysis to refine and optimize your trading strategy.
Let’s take a look at a few examples.
Example 1: ES 1-Hour Chart – September 13 – 18, 2023
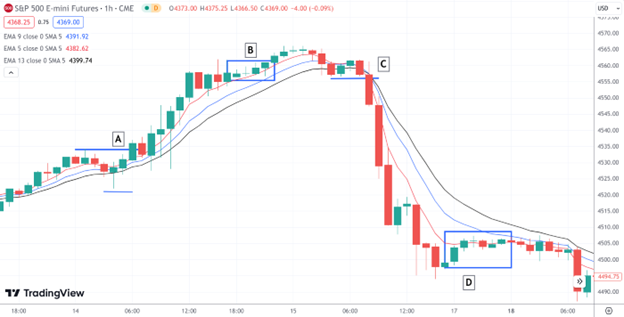
This example illustrates two longer day trades on the S&P futures using the 1-hour chart.
A: Coinciding with the NYSE market open, a trader might have opened a long position, as the 5-8-13 EMA is in full positive position (the 5 EMA is above the 8 EMA which is above the 13 EMA). This is an Opening Range Breakout which tends to be a volatile period in trading as participants are entering their buys and sells at the same time. You would have placed a stop loss below the range swing low.
B: The ES trended steadily in this session, and the slowdown in momentum after market close (see blue rectangle) would have been a good time to close your long position with a positive return.
C: This “short” trade took place at the NYSE market open on the following day, going short upon a break below the small pre-market range.
D: This trade turned out to be more volatile and once momentum slowed after market close (see blue rectangle), it would have been a good time to close a short position, again with a positive return.
Now let’s take a look at an example of the 5-8-13 EMA combo using a much shorter timeframe.
Example 2 : CL – 5-minute chart – September 21, 2023
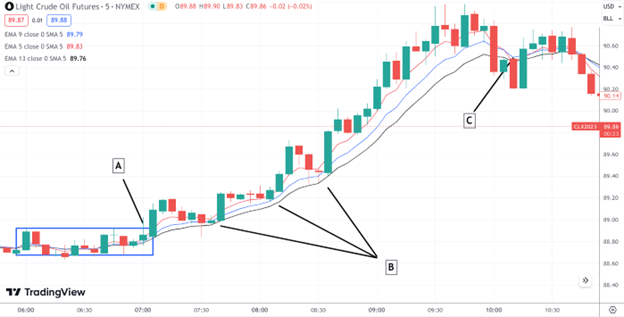
You’re looking at a 5-minute chart of crude oil futures (CL). Similar to the above example, the trade takes place upon a breakout of the opening range.
A: A long trade right at the breakout of the early morning range as the 5-8-13 EMAs into “full sail.” It might be wise to place a stop loss below the lowest point of the range.
B: If you missed the breakout, note the following entry points that came minutes later. Price came close to (or touched) the 13 EMA but the three averages remained in “full sail” mode, indicating continued bullishness.
C: The 5 EMA dips below the 8 EMA as momentum stall; a good exit point for the trade.
Conclusion: The 5-8-13 Combo, a Trader’s Ally
The 5-8-13 EMA combination is a highly valuable tool for day traders navigating the volatility of the markets. This trio, emphasizing recent prices, helps in distinguishing significant market moves from irrelevant noise, which can help you make clearer and more informed trading decisions. When utilized effectively, it can help enhance your precision when timing entries and exits in fast-moving markets. However, given the unpredictability of markets, use this tool judiciously and remain adaptable to any changes that can signal you’re on the wrong side of the trend.
Please be aware that the content of this blog is based upon the opinions and research of GFF Brokers and its staff and should not be treated as trade recommendations. There is a substantial risk of loss in trading futures, options and forex. Past performance is not necessarily indicative of future results.
Be advised that there are instances in which stop losses may not trigger. In cases where the market is illiquid–either no buyers or no sellers–or in cases of electronic disruptions, stop losses can fail. And although stop losses can be considered a risk management (loss management) strategy, their function can never be completely guaranteed.
Disclaimer Regarding Hypothetical Performance Results: HYPOTHETICAL PERFORMANCE RESULTS HAVE MANY INHERENT LIMITATIONS, SOME OF WHICH ARE DESCRIBED BELOW. NO REPRESENTATION IS BEING MADE THAT ANY ACCOUNT WILL OR IS LIKELY TO ACHIEVE PROFITS OR LOSSES SIMILAR TO THOSE SHOWN. IN FACT, THERE ARE FREQUENTLY SHARP DIFFERENCES BETWEEN HYPOTHETICAL PERFORMANCE RESULTS AND THE ACTUAL RESULTS SUBSEQUENTLY ACHIEVED BY ANY PARTICULAR TRADING PROGRAM.
ONE OF THE LIMITATIONS OF HYPOTHETICAL PERFORMANCE RESULTS IS THAT THEY ARE GENERALLY PREPARED WITH THE BENEFIT OF HINDSIGHT. IN ADDITION, HYPOTHETICAL TRADING DOES NOT INVOLVE FINANCIAL RISK, AND NO HYPOTHETICAL TRADING RECORD CAN COMPLETELY ACCOUNT FOR THE IMPACT OF FINANCIAL RISK IN ACTUAL TRADING. FOR EXAMPLE, THE ABILITY TO WITHSTAND LOSSES OR TO ADHERE TO A PARTICULAR TRADING PROGRAM IN SPITE OF TRADING LOSSES ARE MATERIAL POINTS WHICH CAN ALSO ADVERSELY AFFECT ACTUAL TRADING RESULTS. THERE ARE NUMEROUS OTHER FACTORS RELATED TO THE MARKETS IN GENERAL OR TO THE IMPLEMENTATION OF ANY SPECIFIC TRADING PROGRAM WHICH CANNOT BE FULLY ACCOUNTED FOR IN THE PREPARATION OF HYPOTHETICAL PERFORMANCE RESULTS AND ALL OF WHICH CAN ADVERSELY AFFECT ACTUAL TRADING RESULTS.