Relative market bottoms can come in many forms. Identifying potential bottoms can be relatively easy if you know what you are looking for. While many traders are familiar with common bottom-pattern setups, one thing that isn’t discussed often is the possibility of dividing your trades so that you might take advantage of both short-term and longer-term trades should the outcome of your trade move in your favor.
Chart patterns in general tend to be more stable in longer-term time frames–there’s simply less noise in a daily chart than, say, a 15-minute chart or less. Remember that market moves on a wider time frame tend to reflect larger institutional moves that are based on longer-term fundamentals. If you consider that economic trends and monetary decisions don’t change from minute to minute, it makes sense that longer-term time frames tend to better reflect what’s going on in the economy.
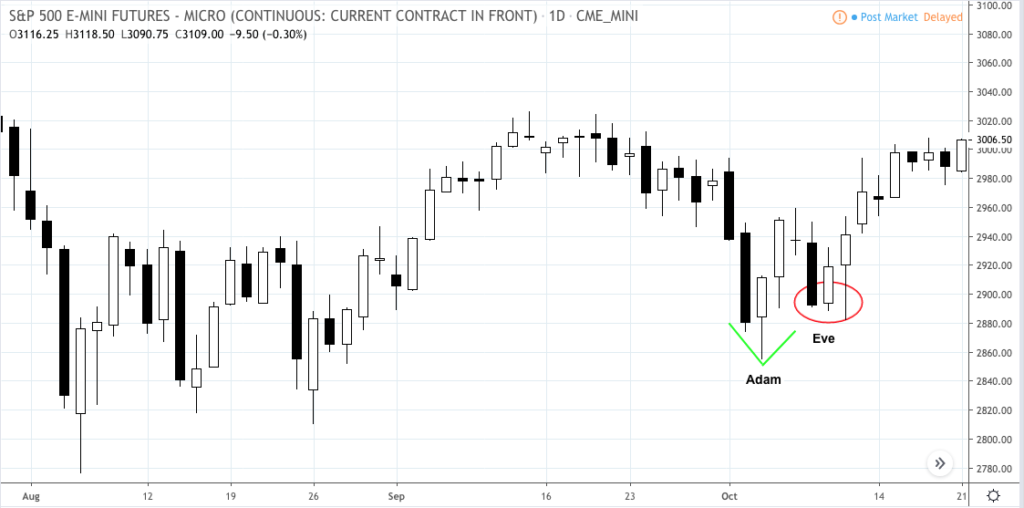
In the period between October 3 and October 10, 2019, the S&P 500 Micro E-mini Futures exhibited a double bottom in the form of a traditional Adam & Eve pattern (Figure 1). The pattern is characterized by a deep first bottom; then the market bounces back and is corrected including a more gentle second bottom with lower volatility.
S&P 500 Micro Emini Futures (MES) – Daily, July 31 to October 21, 2019
The pattern is fairly easy to identify. Now that we’ve identified it, what might be a traditional approach to trading it? Take a look at Figure 2 below.
S&P 500 Micro Emini Futures (MES) – Daily, September 5 to November 20, 2019
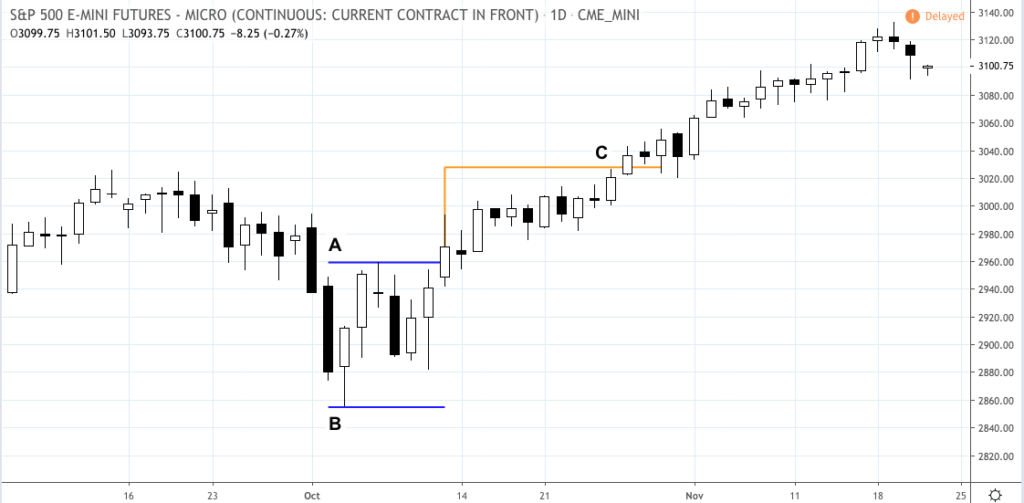
Measure the height of the pattern from the top [A] to the bottom [B]. With a high of 2959.25 and a low of 2855.00, the total height is 104.25.
One traditional approach is to take 66% of the height, which in our case is 68.81. Add the 66% to the top of the pattern at [A] and we get a target [C] of 3028.06. We’ll round that down to 3028.00 since the MES ticks by 0.25 increments. Stop loss is placed a few ticks below the bottom of the patterns at [B].
Since the dollar per tick value of the MES is much smaller than the regular ES, a trader who has enough capital might think of entering two halves of a position: the first half is a swing trade targeting [C], while the second half would keep the position open, moving its stop loss level to breakeven above [A] and riding the position to the extent of the continuing bull run (or at the trader’s discretion).
With the economy showing strength (according to the Federal Reserve), despite geopolitical risks, trade tensions, and evidence of a global slowdown, one might predict that the bull market still has some ways to go. By placing your stop loss at a breakeven point, this might be an opportunity to keep your position open for a much longer swing while attempting to minimize the risks of negative volatility.
Trading a relative bottom like the Adam & Eve might present the opportunity of a bullish swing trade. But if the advance is part of a continuing bull trend, bottoming patterns may also offer the opportunity to get in on a longer-term trade beyond the short-term.
Please be aware that the content of this blog is based upon the opinions and research of GFF Brokers and its staff and should not be treated as trade recommendations. There is a substantial risk of loss in trading futures, options and forex. Past performance is not necessarily indicative of future results.
Be advised that there are instances in which stop losses may not trigger. In cases where the market is illiquid–either no buyers or no sellers–or in cases of electronic disruptions, stop losses can fail. And although stop losses can be considered a risk management (loss management) strategy, their function can never be completely guaranteed.
Disclaimer Regarding Hypothetical Performance Results: HYPOTHETICAL PERFORMANCE RESULTS HAVE MANY INHERENT LIMITATIONS, SOME OF WHICH ARE DESCRIBED BELOW. NO REPRESENTATION IS BEING MADE THAT ANY ACCOUNT WILL OR IS LIKELY TO ACHIEVE PROFITS OR LOSSES SIMILAR TO THOSE SHOWN. IN FACT, THERE ARE FREQUENTLY SHARP DIFFERENCES BETWEEN HYPOTHETICAL PERFORMANCE RESULTS AND THE ACTUAL RESULTS SUBSEQUENTLY ACHIEVED BY ANY PARTICULAR TRADING PROGRAM.
ONE OF THE LIMITATIONS OF HYPOTHETICAL PERFORMANCE RESULTS IS THAT THEY ARE GENERALLY PREPARED WITH THE BENEFIT OF HINDSIGHT. IN ADDITION, HYPOTHETICAL TRADING DOES NOT INVOLVE FINANCIAL RISK, AND NO HYPOTHETICAL TRADING RECORD CAN COMPLETELY ACCOUNT FOR THE IMPACT OF FINANCIAL RISK IN ACTUAL TRADING. FOR EXAMPLE, THE ABILITY TO WITHSTAND LOSSES OR TO ADHERE TO A PARTICULAR TRADING PROGRAM IN SPITE OF TRADING LOSSES ARE MATERIAL POINTS WHICH CAN ALSO ADVERSELY AFFECT ACTUAL TRADING RESULTS. THERE ARE NUMEROUS OTHER FACTORS RELATED TO THE MARKETS IN GENERAL OR TO THE IMPLEMENTATION OF ANY SPECIFIC TRADING PROGRAM WHICH CANNOT BE FULLY ACCOUNTED FOR IN THE PREPARATION OF HYPOTHETICAL PERFORMANCE RESULTS AND ALL OF WHICH CAN ADVERSELY AFFECT ACTUAL TRADING RESULTS.