A Volatile and Confusing Market
This year’s market volatility has been explosive. Prior to the February plunge, the nine-year stock market bull was moving upward in a relatively steady manner.
Despite the uncertainties following this initial plunge, there were (and are still) plenty of media pundits and institutional investors who seem almost certain that the bull market still has legs. To balance that view, there are also plenty of pundits and experts who see the exact opposite.
If you’ve been tuning into financial media to get the latest opinions from top industry experts, you would have received more of the same: experts are divided, and the division can be a bit extreme–not semi-bullish or semi-bearish reports, but strong bullish forecasts countered by “doom and gloom” predictions.
Given the circumstances, most traders and investors are probably having a difficult time forming an intermediate-term opinion.
Despite the uncertainty, price action might have saved you from a loss
Market strategy can involve sophisticated “guesswork.” And if you’re in the “bull” camp, it might have been tricky to find a buy point, particularly if you intended to place a short-term swing trade.
But the price action exhibited by the DJIA over the last few months seems rather clear-cut.
Note that price action is not always a clear or effective indicator, particularly in a non-trending market. But in the case of the Dow, “classic price action” served as a good framework for placing stops and assessing trend outlook.
Take a look at the chart below (DJIA: Daily Chart from July 2017 – May 1)
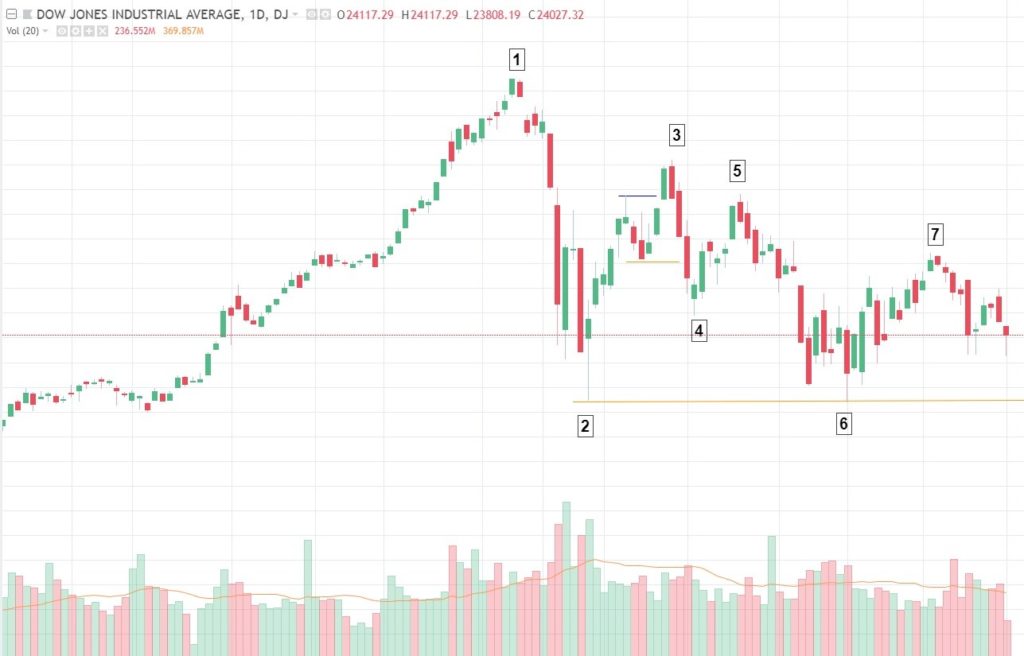
Technical breakdown: (1) and (2) mark the peak and trough. The question many investors and traders were probably asking was whether this decline was a mere correction or whether it might have signaled the end of the bull market.
Some people who were bullish might have entered the markets after (2), after which price peaked at (3). Hopefully, those short-term traders who entered the market between (2) and (3) will have placed their stops at the bottom of (2), the price point at which several bullish buyers jumped in.
The market continued to decline but found support at (4). This marks a key price point, for if the short-term trend were to continue upward, price would have to exceed the swing-high at (3) while remaining above swing-low at (4).
As we can see, price did NOT exceed (3) as it peaked at (5). By this time, some traders might have moved their stops to below (4) which would have been a reasonable tactical stop point. If the market were in a short-term downtrend, it would have to break below (4). And that’s exactly what happened at (6).
Note that (6) is at the same price level as the initial trough (2). As price bounced off (6), the question then was whether price would break above the most recent swing high at (5). For short-term traders who went long at this point, placing a stop at the bottom of (6) might have been a wise idea, as any break below that point would invalidate the short-term bullish outlook. As it turned out, price did not break above (5), peaking instead at (7).
So what we are currently watching out for is any re-test of the (2) and (6) levels. If price breaks below these levels, and if the fundamentals support this break, then such price action might signal a continuing downtrend, one that might form a “major correction” if not the beginning of a bear market. Of course, the latter case must be supported by sound fundamentals.
Takeaway: Technical price action is not a predictor. It should not be taken as the basis for an all-encompassing strategy. But it does serve a tactical function: marking potential breakout and breakdown points. If you traded the recent DJIA market in pursuit of short-term profits, price action might have served you well.
Remember, this is not always the case, as markets can get noisy. Nevertheless, in such scenarios, price action would still serve as an effective gauge of market noise and volatility.