Trading With No Indicators? Let’s Take a Look at 3 Strategies That Often Get Overlooked for Their Simplicity
While learning about market indicators and their use is very important for new traders, the basics of how to read price action should not be overlooked, because after all, a trade starts and ends with the price, and most indicators derive their data from price alone.
In essence, technical analysis as a whole comes from price action since it is the study of past price to make informed trading decisions to help future actions. As a result, there are a lot of traders who rely solely on price charts without adding any indicators, as they believe that all the information they need is already there.
If you’ve never traded solely using price action, it’s not as limiting as you may think.
Here are three strategies to consider:
1. Basic Support and Resistance
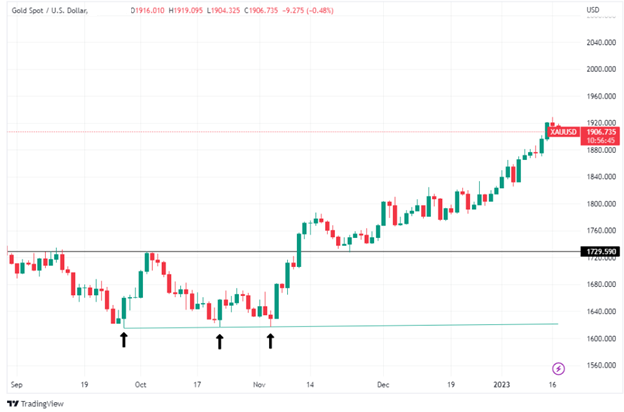
The first and simplest one is to just draw horizontal lines at top and bottoms and use them as support or resistance.
A horizontal line can be drawn with only two points, and the more points it aligns, the stronger the resistance (support) is.
Let’s take a look at the Gold chart below. As we can see, prices were going down and registering lower lows until they reached 1614.00. After a rebound to 1729.00, prices once again tried to break below the 1614.00 level and once again failed. The trader can now draw a line between those two lows and use it as a support. Shortly after, a third and final test to break below this low failed, leading to a huge rebound in Gold prices that hasn’t stopped since. Failure to break below a level multiple times tells us that buyers are drawing a line there and that demand is overpowering supply around these levels, which translates into an inability to break lower.
2. Basic Trendlines
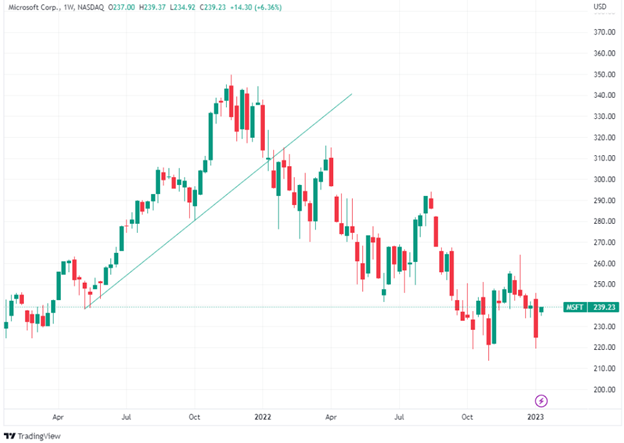
Similar to the first strategy, a trader can use trendlines that connect lows during an uptrend and highs during a downtrend and consider a break of this trendline as a signal that the trend might have changed.
This strategy is important because it shows us that the trend, whether to the upside or the downside, is losing steam. The weekly chart shows a clear uptrend was unfolding and how a break below the trendline was a signal that the trend might be over. More often than not, after the break of a trendline, prices will try to break back above the level, which will give the trader an opportunity to take a position in the direction of the new trend.
3. Failure Swings
Another strategy to use is the failure swing.
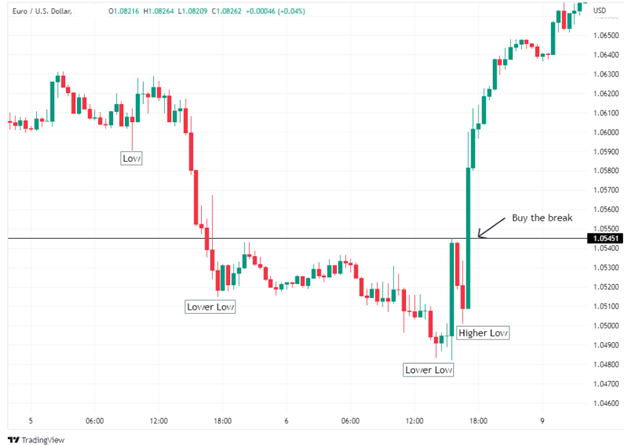
After an uptrend, a failure swing occurs when prices fail to reach the previous high and resume lower. After a downtrend, it is the opposite, with prices failing to reach the previous lower and resume higher. The trader can then take a position on the break of the previous low in an uptrend, and the break of the previous high in a downtrend. Let’s take a look at an example. On this 30-minute Euro chart, we can see the pair trading lower, registering lower lows in the process. Then, prices rally to 1.0545 and fail to register a lower low. A failure swing is then confirmed after prices break above the 1.0545 high.
Too Simple an Approach?
Does this appear too simplistic? If so, explore these tools and see how much mileage you can actually get from using price alone. Try incorporating chart patterns with them and see what happens.
Better yet, if you look for patterns of behavior in relation to just these three strategies alone, you may find that there’s historical consistency in them, at least enough to provide data for a much wider statistical study of price action patterns.
The Bottom Line
These are just some of the basic strategies that can be used without the need of an indicator. As we can see, prices alone are more than enough to tell us what we need to know about market psychology. The use of indicators is just for confirmation purposes.
Please be aware that the content of this blog is based upon the opinions and research of GFF Brokers and its staff and should not be treated as trade recommendations. There is a substantial risk of loss in trading futures, options and forex. Past performance is not necessarily indicative of future results.
Disclaimer Regarding Hypothetical Performance Results: HYPOTHETICAL PERFORMANCE RESULTS HAVE MANY INHERENT LIMITATIONS, SOME OF WHICH ARE DESCRIBED BELOW. NO REPRESENTATION IS BEING MADE THAT ANY ACCOUNT WILL OR IS LIKELY TO ACHIEVE PROFITS OR LOSSES SIMILAR TO THOSE SHOWN. IN FACT, THERE ARE FREQUENTLY SHARP DIFFERENCES BETWEEN HYPOTHETICAL PERFORMANCE RESULTS AND THE ACTUAL RESULTS SUBSEQUENTLY ACHIEVED BY ANY PARTICULAR TRADING PROGRAM.
ONE OF THE LIMITATIONS OF HYPOTHETICAL PERFORMANCE RESULTS IS THAT THEY ARE GENERALLY PREPARED WITH THE BENEFIT OF HINDSIGHT. IN ADDITION, HYPOTHETICAL TRADING DOES NOT INVOLVE FINANCIAL RISK, AND NO HYPOTHETICAL TRADING RECORD CAN COMPLETELY ACCOUNT FOR THE IMPACT OF FINANCIAL RISK IN ACTUAL TRADING. FOR EXAMPLE, THE ABILITY TO WITHSTAND LOSSES OR TO ADHERE TO A PARTICULAR TRADING PROGRAM IN SPITE OF TRADING LOSSES ARE MATERIAL POINTS WHICH CAN ALSO ADVERSELY AFFECT ACTUAL TRADING RESULTS. THERE ARE NUMEROUS OTHER FACTORS RELATED TO THE MARKETS IN GENERAL OR TO THE IMPLEMENTATION OF ANY SPECIFIC TRADING PROGRAM WHICH CANNOT BE FULLY ACCOUNTED FOR IN THE PREPARATION OF HYPOTHETICAL PERFORMANCE RESULTS AND ALL OF WHICH CAN ADVERSELY AFFECT ACTUAL TRADING RESULTS.