Today’s market is like a cauldron of blisteringly hot and toxic economic soup. Let’s take a look at our ingredient list. Inflation, check. Potential wage spiral, check. Pandemic variants, check. Global GDP downgrades, and domestic and geopolitical risks—check, check, and check.
If you follow mainstream financial media, you might notice many conflicting forecasts among experts whose distinct strategies—bullish and bearish, short-term and long-term—may converge or collide in the market. Volatility, or even extreme volatility, may be the only certain thing we can expect.
Volatility Presents Both Opportunity and Risk
Investors generally fear volatility. Traders, in contrast, sometimes welcome it. This is not to say that traders are not investors and vice versa, but depending on which “market hat” you decide to don, be sure you’re looking at volatility the right way so as to make sure you’re adequately dressed for the right party.
The big difference here is that investors tend to do best by focusing on “time in the market.” Traders, on the other hand, are always trying to “time the market.” As a short-term trader, that’s your job. However, be sure to keep one eye fixed on the horizon, especially considering the big storm that appears to be heading our way.
Be Sure to View the Larger Landscape
Whether you’re a day trader or swing trader, you’re engaging a small portion of a larger map. Longer-term trend traders get a pass on this. But most futures day traders like to stay on the near-term end of things. Still, you can’t afford to be myopic; especially, in a market that’s loaded with many potential economic traps and landmines.
Five Pointers for Navigating a Volatile Market
Okay, here we go. This blog is intended for traders attempting to trade potentially volatile markets. These pointers aim to help you not get wiped out, tripped up, or just lost amid the turbulence of asset prices. That said, trading volatile markets is highly risky!
One – Know Your Critical Levels of Support and Resistance
If you were day trading the YM on January 24, 2022 without looking at the larger time frame, you were probably surprised when the YM suddenly stopped and reversed. Most traders who kept their eye on the big technical picture likely jumped in at the low. How’d they predict it?
Dow Futures (YM) – 5-Minute Chart – January 24, 2022 (source: Tradingview)
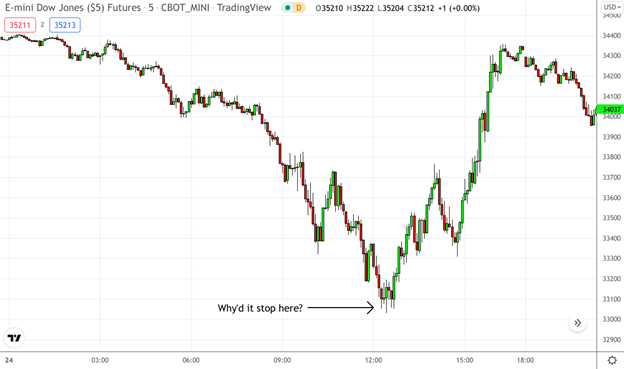
It matched a critical support level established in June 2021.
Dow Futures (YM) – Weekly Chart – May 2021 to February 2022 (source: Tradingview)
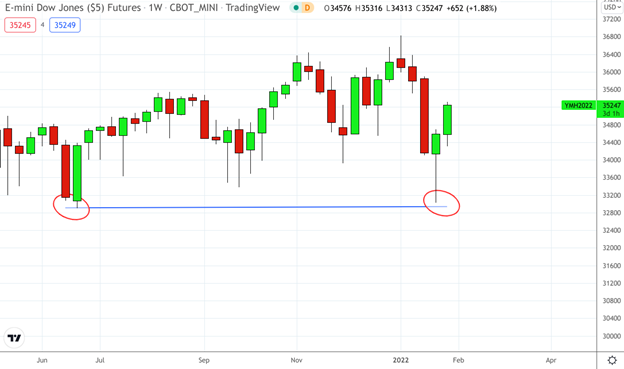
If you can’t see the critical areas where bulls and bears converge and clash, then you are setting yourself up for either a favorable or unfavorable surprise. Navigate the map to get a better sense of where price might hit a speed bump, target, or reversal.
Two – Keep Your Eye on the Trend
Traders or investors who are not accustomed to volatility can easily get shaken out of the markets because they don’t know where prices are going (in general), nor do they know how to measure (and guesstimate) how far prices might go before reversing or continuing. What’s even trickier is that volatility can occur in both trending and non-trending markets.
Take a look at the Natural Gas Futures below.
Natural Gas Futures (NG) – Daily Chart – March 2021 to February 2022 (source: Tradingview)
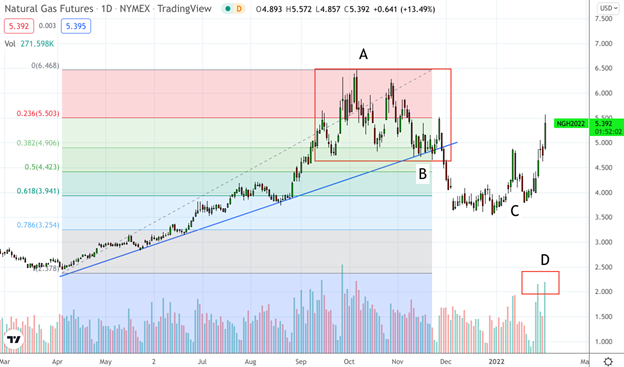
The volatile period at [A] might have confused or shaken out many market participants seeking clear directionality. NG was fluctuating up and down within a large trading range. But if you look at the big picture, all market action from April to the end of November 2021 was on an uptrend (despite the smaller dips). That finally broke at [B]. Notice, however, that buyers jumped in at [C]. That’s because buyers, for whatever fundamental reasons they had to buy, thought it was best to jump in near the 61.8% Fibonacci retracement level. And the volume at [D] shows this to be the case.
Three – Look for Overbought and Oversold Levels
Whether you’re trading on a short-term or long-term time frame, there are always “overbought” and “oversold” levels. These terms are not to be taken as “absolute” levels, they just mean that for the time being, an asset has gone too high or too low and has to level out to an average before continuing (or reversing). Remember, nothing moves in a straight line; what comes up must come down, and vice versa, if only temporarily.
Gold Futures (GC) – Daily Chart – July 2021 to February 2022 (source: Tradingview)
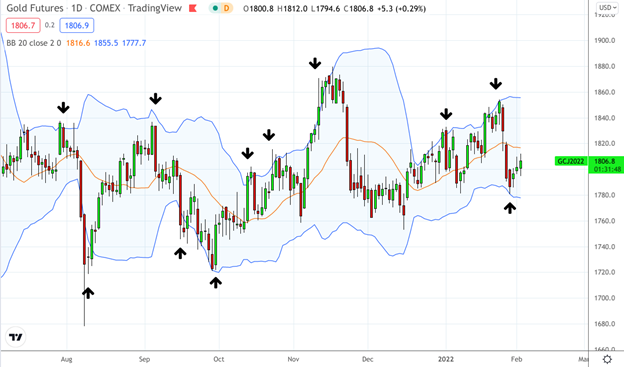
Bollinger Bands can help you forecast whether an asset’s price is due for a pullback in either direction. Typically, when price touches either standard deviation band, up or down, it tends to pull back up or down to the moving average. There’s no guarantee that this will happen every time, but it happens consistently enough, especially in a sideways market, to help you get a better sense of price’s near-term directionality.
Four – Look for Chart Patterns
When prices swing up and down, their individual swings can seem baffling, especially if you can find any pattern to the volatility. But more often than not, patterns are being formed.
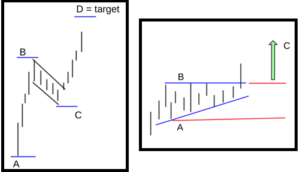
If you know how to trade classic chart patterns, you may have a serious analytical advantage: you’ll know what’s traditionally expected, whether price is following or breaking the pattern, and how to trade it if the pattern exhibits a good return-to-risk scenario.
Five – Know What’s Happening in the Economy and When It’s Being Reported
If you’re not already accustomed to following fundamental and economic indicators, it may seem confusing at first. But ultimately, once you get the hang of it, you’ll likely attain a high-level perspective of what’s going on in the markets and economy.
There are so many examples in today’s markets, but we’ll focus on just a few, as the topic exceeds this post.
Rate Hikes: Some traders find it important to position themselves for a Fed rate hike scenario. To stack their odds ahead of the FOMC announcement, some look at the US 2-Year Treasury yield. Although the Fed pays close attention to yields and yield spreads, some analysts argue that the 2-year does a better job at predicting rate hikes than, say, the 10-year.
Hidden Stock Market Weaknesses/Strengths: Longer-term US index traders who try to get in early ahead of a bull or bear market may look at the percentage of stocks (within an index or across the broader market) trading above or below their 200-day moving average. Why? An index, like the S&P 500, can rise while more than 50% of the stocks in the index are falling, giving a clear hint of cracks in the index’s momentum. Conversely, 50% of stocks can be trading above their 200-day MA while the index is crashing in a bear market; an indication of hidden strength within the decline.
Inflation: At the beginning of 2022, the inflation rate rose significantly to 7%. Some economists argue that inflation was already present in 2020, when the “headline” inflation rate was still under 2%. How’s that possible? The Money Supply swelled to unprecedented levels as shown below.
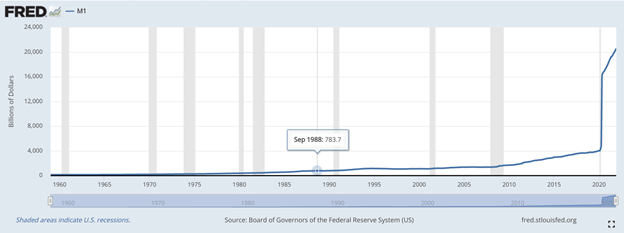
When the central bank “prints” money, that constitutes inflation which, arguably, is a “monetary” phenomenon. Higher prices in goods and services is merely a secondary effect of “too much money chasing too few goods,” which is the classic inflation definition.
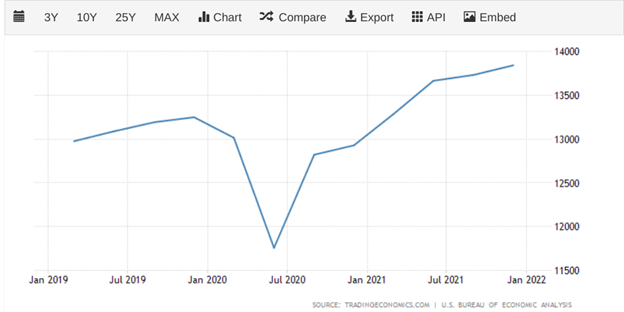
But still, inflation didn’t begin hitting our grocery shelves, used car lots, and other consumer segments until 2021. What happened? Most people were saving money and not spending it. When retail spending began ticking up, inflation reared its ugly head.
But still, spending is still at all time lows, as shown in the Velocity of Money chart.
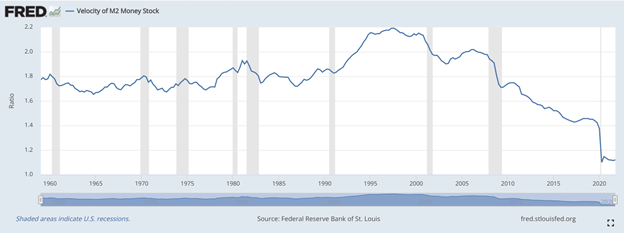
What will the effect of more spending be on inflation, monetary policy, stock market volatility, and commodities once it begins advancing? This is something to think about.
The potentially extreme volatility we’re likely to encounter in 2022 (and possibly beyond) is centered on inflation, the Fed’s policy response to inflation, Covid-19 variant effects, and geopolitical and geopolitical factors—most of which are wildcards.
The point here is to pay attention to what’s happening and watch your economic calendar closely for market-moving releases. The more you can see and anticipate, the less turbulent the effect volatility will have on your portfolio, trading account, and overall trading mindset.
Volatility Presents Opportunities and Risks
While investors typically shy away from volatility, preferring a smoother return trajectory, traders often engage volatility, riding the waves up and down. Similar to how surfers seek decent wave action on a beach, they have to understand the nature of the waters in which they surf. This means understanding the nature of tides and currents, being able to distinguish favorable from dangerous surf conditions, and having the knowledge and capacity to survive should they find themselves stuck in the ocean under hazardous conditions.
The same can be said for trading. If you know where prices are likely to get stuck, reverse, or continue, and if you can understand the economic headwinds and tailwinds surrounding the market environment, then riding the price waves can present rewarding opportunities with muted risks. There are plenty of other ways to engage a volatile market environment. The few we’ve presented above are enough to help you get yourself situated.
Please be aware that the content of this blog is based upon the opinions and research of GFF Brokers and its staff and should not be treated as trade recommendations. There is a substantial risk of loss in trading futures, options and forex. Past performance is not necessarily indicative of future results.
Disclaimer Regarding Hypothetical Performance Results: HYPOTHETICAL PERFORMANCE RESULTS HAVE MANY INHERENT LIMITATIONS, SOME OF WHICH ARE DESCRIBED BELOW. NO REPRESENTATION IS BEING MADE THAT ANY ACCOUNT WILL OR IS LIKELY TO ACHIEVE PROFITS OR LOSSES SIMILAR TO THOSE SHOWN. IN FACT, THERE ARE FREQUENTLY SHARP DIFFERENCES BETWEEN HYPOTHETICAL PERFORMANCE RESULTS AND THE ACTUAL RESULTS SUBSEQUENTLY ACHIEVED BY ANY PARTICULAR TRADING PROGRAM.
ONE OF THE LIMITATIONS OF HYPOTHETICAL PERFORMANCE RESULTS IS THAT THEY ARE GENERALLY PREPARED WITH THE BENEFIT OF HINDSIGHT. IN ADDITION, HYPOTHETICAL TRADING DOES NOT INVOLVE FINANCIAL RISK, AND NO HYPOTHETICAL TRADING RECORD CAN COMPLETELY ACCOUNT FOR THE IMPACT OF FINANCIAL RISK IN ACTUAL TRADING. FOR EXAMPLE, THE ABILITY TO WITHSTAND LOSSES OR TO ADHERE TO A PARTICULAR TRADING PROGRAM IN SPITE OF TRADING LOSSES ARE MATERIAL POINTS WHICH CAN ALSO ADVERSELY AFFECT ACTUAL TRADING RESULTS. THERE ARE NUMEROUS OTHER FACTORS RELATED TO THE MARKETS IN GENERAL OR TO THE IMPLEMENTATION OF ANY SPECIFIC TRADING PROGRAM WHICH CANNOT BE FULLY ACCOUNTED FOR IN THE PREPARATION OF HYPOTHETICAL PERFORMANCE RESULTS AND ALL OF WHICH CAN ADVERSELY AFFECT ACTUAL TRADING RESULTS.