Demystifying the Cloud: A Comprehensive Guide to Ichimoku Cloud Charts
- The Ichimoku Cloud is a versatile market analysis tool, providing insights on support and resistance levels, trends, and potential future price movements.
- Consisting of five components, the Ichimoku Cloud allows for a comprehensive view of the market, helping traders make more informed decisions.
- Understanding and effectively using the Ichimoku Cloud in conjunction with other strategies can enhance your market analysis and trading approach.
Most indicators use past data to give us an idea about what’s happening now or in the future, but the current price won’t necessarily follow its projections or predictions.
That’s why looking at pure price action is often the most accurate way to read the market. But, let’s be honest, sometimes price action alone doesn’t give us enough guidance, and trading without any indicator can feel like taking a step forward in the dark. After all, every step we take into the future is a little bit uncertain, right?
So, considering this challenge of dealing with the unknown, smart traders try to anticipate different possible outcomes and have a few backup plans ready. Using indicators wisely is all about anticipating (not “predicting”) multiple scenarios, and some indicators, like the Ichimoku Cloud, can really help with that. With the “cloud,” you get five components that come in various combinations and interpretations, giving you more insights into potential market moves.
History of the Ichimoku Cloud
So, the story of the Ichimoku Cloud dates back in the late 1930s with a Japanese journalist named Goichi Hosoda. He was really into stock market analysis and wanted to develop a comprehensive tool that would help traders see the bigger picture when it came to market trends.
Hosoda spent around 30 years refining his concept. He teamed up with a group of students who helped him test different formulas and calculations. Finally, in 1968, they came up with the Ichimoku Cloud, also known as the Ichimoku Kinko Hyo. The name roughly translates to “one glance equilibrium chart,” which basically means you can get a good idea of the market’s situation just by taking a quick look at the chart.
The Ichimoku Cloud became quite popular in Japan, especially among traders and investors who appreciated its ability to show multiple data points on a single chart. It provided information about support and resistance levels, trends, and potential future price movements, all in one glance.
Now, let’s explore how to use it.
The Components of the Ichimoku Cloud
The Ichimoku has five lines or calculations:
- Conversion Line (Tenkan-sen): [9-period high + 9-period low] ÷ 2
- Base Line (Kijun-sen): [26-period high + 26-period low] ÷ 2
- Leading Span 1 (Senkou Span 1): [Conversion Line + Base Line] ÷ 2
- Leading Span 2 (Senkou Span 2): [52-period high + 52-period low] ÷ 2
- Lagging Span (Chikou span): Close plotted 26 days in the past
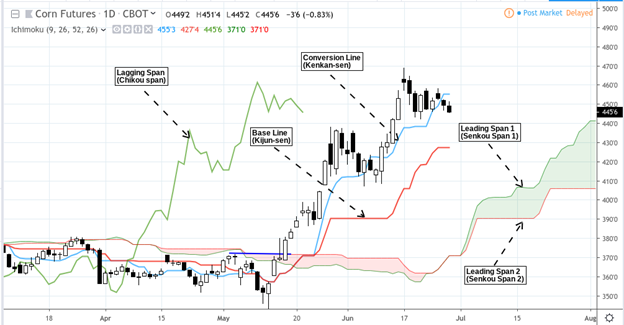
So, when you’re looking at the Ichimoku Cloud (as shown in the an example chart above), you’ll see that each part is a special kind of moving average, except for the Lagging Span, which actually shows the closing price from 26 days ago.
Now, the cool thing about the Leading Spans 1 and 2 is that they’re projected 26 days into the future, creating this “cloud” between them. The cloud can give you an idea of future support and resistance levels. If Span 1 is above Span 2, the cloud is green, and if it’s the other way around, the cloud turns red.
And about the Lagging Span – even though it’s 26 days behind, it helps you get a feel for the current market situation by showing you the dynamics of past movement. So, when you put it all together, the Ichimoku Cloud gives you a way to project possible future support and resistance, while the Lagging Span helps you make sense of what’s happening right now based on past trends.
How to Analyze the Ichimoku Cloud
The Cloud (Kumo)
The cloud is probably the most crucial part of the Ichimoku indicator, and it helps you figure out the overall trend in two ways:
- First, if the prices are above the cloud, the trend is going up, and if they’re below the cloud, the trend is going down.
- Second, an uptrend gets even stronger when the cloud is green (meaning Leading Span 1 is above Leading Span 2), and on the flip side, a downtrend is considered strong when the cloud is red (when Leading Span 1 is below Leading Span 2).
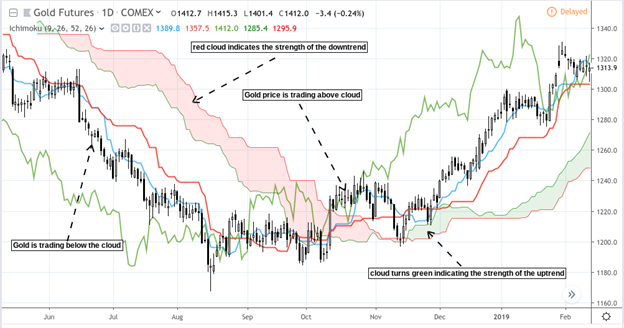
Compare the Ichimoku chart above with a Simple Moving Average (SMA) chart below:
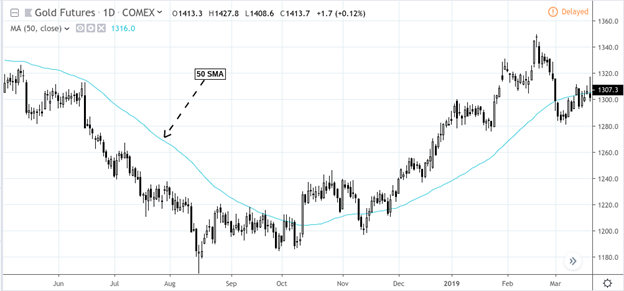
For certain traders, this information could be sufficient. However, for others, the Ichimoku arguably offers additional and more accurate confirmation.
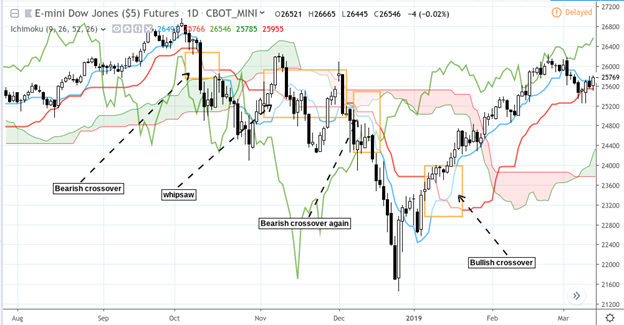
Conversion-Base Crossovers
When the conversion line goes above the base line and the price is higher than the conversion line, it might be a sign to buy. On the other hand, if the conversion line goes below the base line, it could be a signal to sell.
However, keep in mind that these crossovers can sometimes lead to false signals when the price isn’t moving strongly in a particular direction, or if the trend is unclear or debated.
Compare this with a 10-day and 50-day Simple Moving Average (SMA) crossover:
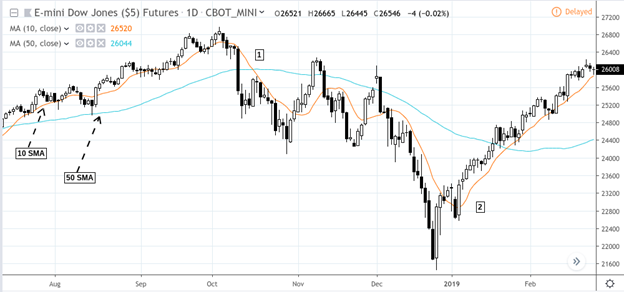
Keep in mind that at point [1], the price still shows back-and-forth movement, and at point [2], the crossover captured the uptrend later than the conversion-base crossover. When compared to just looking at price movements, both the Ichimoku and simple moving average crossovers were a bit late.
Price-Base Crossovers
Like moving averages, when the price goes above or below the Ichimoku base line, it might be a sign that a trend change is starting to happen.
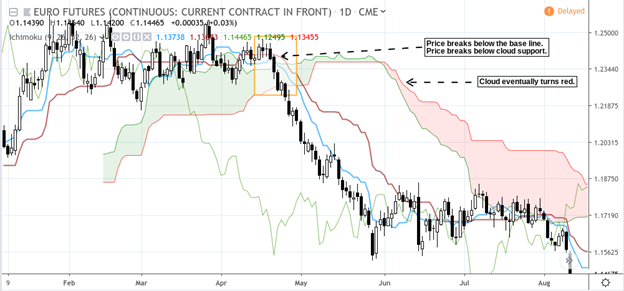
Unlike a moving average, the “cloud” can provide a support, as seen from March to May. This is something that moving averages aren’t always capable of offering in terms of a support or resistance range.
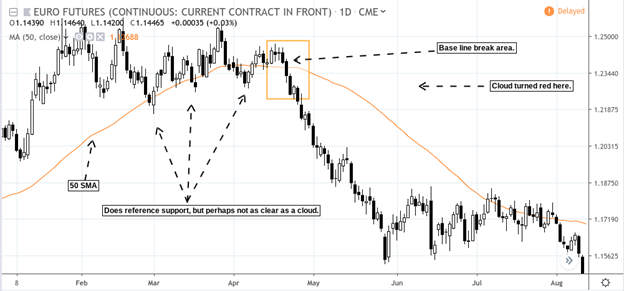
Which set of indicators would have been clearer? That’s for you to decide. However, this leads us to the final and perhaps most significant “predictive” feature of the indicator – the cloud projected into the future.
What’s in the Forecast?
If we take a price range from the past and project it 26 days into the future, how do you think it could affect your outlook moving forward? Would it make it easier or more challenging for you to think, plan, or respond in real-time?
Here’s a chart of the S&P 500 futures prices when this was written. Check out the “future” projection for this particular futures contract.
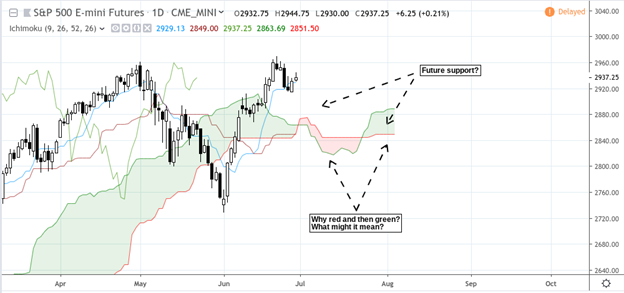
Right now, the price seems to be on the upswing, but the forecast shows a red cloud turning green in about 10 days. Do these cloud areas indicate possible support levels? Would you get a clearer picture from just looking at the price action alone, or does the price action-based cloud model highlight these areas better for future predictions?
The Bottom Line
The Ichimoku Cloud is a unique and versatile tool for market analysis, offering traders insights into support and resistance levels, trends, and potential future price movements. While no indicator is perfect, using the Ichimoku Cloud can provide a comprehensive view of the market, helping traders make more informed decisions.
As with any trading tool, the key is to understand its strengths and limitations and to use it effectively in conjunction with other strategies. Whether you’re a seasoned trader or just starting out, the Ichimoku Cloud may be worth exploring as a means of enhancing your market analysis and trading approach.
Remember, the market is always changing, and so are the tools we use to navigate it. Embrace the challenge, continue learning, and always be open to new ideas and methods.
Please be aware that the content of this blog is based upon the opinions and research of GFF Brokers and its staff and should not be treated as trade recommendations. There is a substantial risk of loss in trading futures, options and forex. Past performance is not necessarily indicative of future results.
Disclaimer Regarding Hypothetical Performance Results: HYPOTHETICAL PERFORMANCE RESULTS HAVE MANY INHERENT LIMITATIONS, SOME OF WHICH ARE DESCRIBED BELOW. NO REPRESENTATION IS BEING MADE THAT ANY ACCOUNT WILL OR IS LIKELY TO ACHIEVE PROFITS OR LOSSES SIMILAR TO THOSE SHOWN. IN FACT, THERE ARE FREQUENTLY SHARP DIFFERENCES BETWEEN HYPOTHETICAL PERFORMANCE RESULTS AND THE ACTUAL RESULTS SUBSEQUENTLY ACHIEVED BY ANY PARTICULAR TRADING PROGRAM.
ONE OF THE LIMITATIONS OF HYPOTHETICAL PERFORMANCE RESULTS IS THAT THEY ARE GENERALLY PREPARED WITH THE BENEFIT OF HINDSIGHT. IN ADDITION, HYPOTHETICAL TRADING DOES NOT INVOLVE FINANCIAL RISK, AND NO HYPOTHETICAL TRADING RECORD CAN COMPLETELY ACCOUNT FOR THE IMPACT OF FINANCIAL RISK IN ACTUAL TRADING. FOR EXAMPLE, THE ABILITY TO WITHSTAND LOSSES OR TO ADHERE TO A PARTICULAR TRADING PROGRAM IN SPITE OF TRADING LOSSES ARE MATERIAL POINTS WHICH CAN ALSO ADVERSELY AFFECT ACTUAL TRADING RESULTS. THERE ARE NUMEROUS OTHER FACTORS RELATED TO THE MARKETS IN GENERAL OR TO THE IMPLEMENTATION OF ANY SPECIFIC TRADING PROGRAM WHICH CANNOT BE FULLY ACCOUNTED FOR IN THE PREPARATION OF HYPOTHETICAL PERFORMANCE RESULTS AND ALL OF WHICH CAN ADVERSELY AFFECT ACTUAL TRADING RESULTS.