When trading crude oil futures (or any market for that matter), success hinges on the ability to read the market accurately. Indicators can be of great assistance, and the following set of indicators can be effective for each market. For crude oil, three time-tested and crucial indicators often come into play: Fundamental data, momentum indicators, and support and resistance levels. Some professionals would argue that they comprise the backbone of many successful trading strategies.
A Powerful Combo: Fundamentals, Momentum, and S/R Levels
Why fundamental data? Because it offers a strategic macro view, it can help you understand the bigger economic picture influencing oil prices.
Why momentum? Momentum is what fuels a market’s drive toward a given direction. Without momentum, a trend might not get very far.
Why support and resistance levels? There are your critical guideposts that mark potential turning points. It’s where buyers or sellers have taken action en masse. Hence, bulls and bears are likely going to meet there again, to try to control the direction of the market.
Let’s take a look at each one and remember that each comes with its unique components. Select those that best align with your personal trading style and risk appetite, creating a tailored approach that can enhance your trading.
Fundamental Data is Key To Forming Your Strategic Outlook
Day traders in the crude oil market need to be extremely attentive to a range of news events and economic reports that can trigger immediate volatility and create trading opportunities.
CAVEAT: The following may seem complex. But if you want to “go pro,” then you’ll need to work these insights into your technical trading strategies.
Here’s a detailed list of some of the most significant fundamentals to monitor closely:
1 – Inventory Data:
- Energy Information Administration (EIA) Weekly Petroleum Status Report: This is a critical report released weekly that provides data on U.S. crude inventories, as well as production, imports, and refinery throughput. Large deviations from forecasts can cause significant price movements.
- American Petroleum Institute (API) Weekly Statistical Bulletin: Published weekly, ahead of the EIA data, the API’s report gives an early indication of inventory changes which can affect trading patterns.
2 – Geopolitical Events:
- OPEC Meetings: Decisions on oil production quotas by the Organization of the Petroleum Exporting Countries (OPEC) can lead to immediate price fluctuations.
- Political Instability: Regions critical to oil production, like the Middle East, often experience political events that can impact oil supply.
- Military Conflicts: Any military action in key oil-producing regions can disrupt supply chains and affect prices.
3 – Economic Indicators:
- Gross Domestic Product (GDP) Reports: Strong or weak GDP numbers from major economies can indicate future demand for oil.
- Industrial Production Numbers: As a proxy for economic activity, these figures can suggest increasing or decreasing demand for oil.
- Purchasing Managers’ Index (PMI): This measures the economic health of the manufacturing sector and can indicate demand for energy.
4 – Monetary Policy Announcements:
- FOMC Announcements: Changes in interest rates or quantitative easing policies can affect the value of the dollar, which is inversely related to commodity prices including oil.
- European Central Bank (ECB) and Other Central Banks: Their policies can also influence the global economic outlook and, consequently, oil demand and pricing.
5 – Currency Fluctuations:
- US Dollar Index Movements: Since oil is priced in dollars, any significant movement in the value of the dollar can impact oil prices.
- BRICS Developments: This can significantly influence global economic dynamics and energy demand, not only because of the influence that the new Eurasian bloc exerts on oil trading but also because of the de-dollarization efforts that many countries are undergoing (bypassing the Petrodollar for Petroyuan).
6 – Weather-Related News:
- Hurricanes and Natural Disasters: Severe weather can disrupt production, especially in areas like the Gulf of Mexico.
- Seasonal Weather Patterns: Seasonal changes can affect oil demand, for example, increased heating oil demand in winter.
7 – Energy Sector-Specific Reports:
- Rig Count: Baker Hughes releases a weekly count of oil rigs, which can be an indicator of future production.
- Pipeline and Infrastructure Issues: News about pipeline disruptions or failures can immediately affect oil supply perceptions.
8 – Unexpected Events:
- Accidents and Attacks: Oil tanker hijackings, pipeline explosions, and refinery accidents can cause short-term price spikes.
- Economic Sanctions: New or lifted sanctions on oil-producing countries can alter supply forecasts.
9 – Market Sentiment and Demand Indicators:
- Commitments of Traders (COT) Report: While this is more relevant to medium and long-term traders, sudden shifts in trader positioning can also offer cues to day traders.
- Transportation Data: Airline and shipping fuel consumption rates can give insights into demand trends.
- Car Sales Data: As an indirect indicator, higher car sales especially in large markets like China or the US, may translate to increased oil demand.
10 – Trade Policies:
- Trade Deals or Tariffs: News regarding trade negotiations or the imposition of tariffs can influence economic activity and thus oil demand.
Momentum Oscillators
Momentum oscillators are technical analysis tools that measure the speed and change of price movements, effectively quantifying the momentum behind a directional price trend. Common examples of momentum oscillators include the Moving Average Convergence Divergence (MACD), Relative Strength Index (RSI), and Stochastics. These tools are particularly beneficial for day trading in the crude oil market, a domain known for its high volatility and rapid price movements characteristic of West Texas Intermediate (WTI) futures.
The use of momentum oscillators offers several key advantages to day traders:
- Versatility Across Time Frames: These tools are adaptable and can be applied effectively across various intraday time frames, from minute-by-minute analysis to hourly trends.
- Strength Assessment: They excel in gauging the strength of short-term trends, providing traders with insights into whether a movement is gaining or losing momentum.
- Reversal and Exhaustion Identification: Momentum oscillators are adept at pinpointing potential reversal points and exhaustion in price movements, key moments where trends might change direction.
- Diverse Strategies: These oscillators are particularly useful for a range of trading strategies, including breakout trading, where traders capitalize on price movements breaking through a defined range, reversal strategies that focus on points where trends change direction, and multiple time frame analysis, offering a more comprehensive view of market trends.
Example: CL downtrend signaled by MACD and Signal Line Crossover
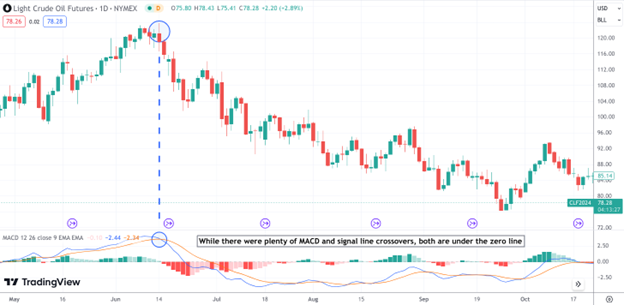
While there were plenty of bullish (MACD and signal line) crossovers during the entire downtrend, note that both MACD and signal lines were under the zero line, indicating that the bullishness may not have had any significant momentum.
Support & Resistance Levels
Support and Resistance levels (SRs) are vital components in technical analysis, serving as predetermined price points where the price action of an asset, like crude oil, tends to face obstruction. These levels are derived empirically, often calculated using various technical indicators such as Fibonacci retracement tools, pivot points, moving averages, and Bollinger Bands. The concept behind SRs is based on market psychology and past price behavior.
The use of SRs brings useful insight to traders:
- Precision in Price Points: SRs offer precise price levels, reducing ambiguity in decision-making. A support level, situated below the current price, acts as a floor that price struggles to break through, whereas a resistance level, located above the current price, acts as a ceiling resisting upward price movement.
- Strategic Market Entry/Exit: These levels are instrumental in identifying possible market entry and exit points. Traders often use support levels as potential entry points or places to set stop-loss orders, while resistance levels can signal an ideal moment to take profits or enter a short position.
- Complementary Analysis: SRs can be effectively combined with other technical indicators and market analyses. They synergize particularly well with momentum oscillators for a more rounded trading strategy and can also be aligned with fundamental analysis, providing a holistic approach to market dynamics.
In live market conditions, SRs offer day traders price levels that can be useful for effective trade planning. They enhance decision-making for market entry, exit, and management of open positions. Furthermore, their integration with other crude oil day trading indicators or fundamental data allows for more robust and informed trading strategies.
Example: Historical Support and Resistance
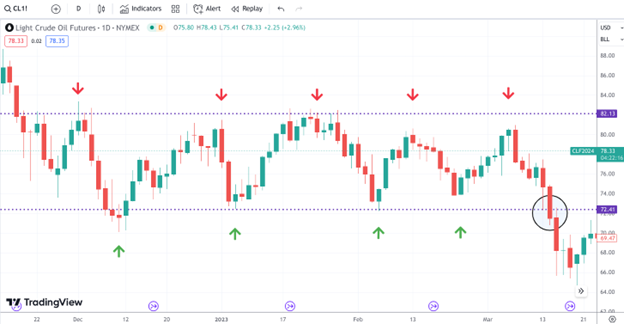
Note how the market responded strongly to established support and resistance areas before finally breaking below the trading range (see black circle toward the right of the chart). While there are many ways to draw support and resistance levels using various tools such as Fibonacci retracements and trendlines, among many others, market-based SR levels (as shown above) can be useful.
This is because they reflect the collective psychology and decision-making of market participants, representing areas where buying and selling pressures have historically balanced out. As such, when these levels are respected or breached, it can indicate a significant shift in market sentiment, offering valuable insights for traders.
The Bottom Line
You can potentially trade crude oil futures successfully using just these three core indicators: insightful fundamental data for a macroeconomic perspective, momentum indicators to gauge market trends, and precise support and resistance levels for strategic trade execution. If you can combine these indicators skillfully, you may be able to navigate the complexities of the oil market with greater accuracy and more confidence. Good luck, and happy trading!
Please be aware that the content of this blog is based upon the opinions and research of GFF Brokers and its staff and should not be treated as trade recommendations. There is a substantial risk of loss in trading futures, options and forex. Past performance is not necessarily indicative of future results.
Be advised that there are instances in which stop losses may not trigger. In cases where the market is illiquid–either no buyers or no sellers–or in cases of electronic disruptions, stop losses can fail. And although stop losses can be considered a risk management (loss management) strategy, their function can never be completely guaranteed.
Disclaimer Regarding Hypothetical Performance Results: HYPOTHETICAL PERFORMANCE RESULTS HAVE MANY INHERENT LIMITATIONS, SOME OF WHICH ARE DESCRIBED BELOW. NO REPRESENTATION IS BEING MADE THAT ANY ACCOUNT WILL OR IS LIKELY TO ACHIEVE PROFITS OR LOSSES SIMILAR TO THOSE SHOWN. IN FACT, THERE ARE FREQUENTLY SHARP DIFFERENCES BETWEEN HYPOTHETICAL PERFORMANCE RESULTS AND THE ACTUAL RESULTS SUBSEQUENTLY ACHIEVED BY ANY PARTICULAR TRADING PROGRAM.
ONE OF THE LIMITATIONS OF HYPOTHETICAL PERFORMANCE RESULTS IS THAT THEY ARE GENERALLY PREPARED WITH THE BENEFIT OF HINDSIGHT. IN ADDITION, HYPOTHETICAL TRADING DOES NOT INVOLVE FINANCIAL RISK, AND NO HYPOTHETICAL TRADING RECORD CAN COMPLETELY ACCOUNT FOR THE IMPACT OF FINANCIAL RISK IN ACTUAL TRADING. FOR EXAMPLE, THE ABILITY TO WITHSTAND LOSSES OR TO ADHERE TO A PARTICULAR TRADING PROGRAM IN SPITE OF TRADING LOSSES ARE MATERIAL POINTS WHICH CAN ALSO ADVERSELY AFFECT ACTUAL TRADING RESULTS. THERE ARE NUMEROUS OTHER FACTORS RELATED TO THE MARKETS IN GENERAL OR TO THE IMPLEMENTATION OF ANY SPECIFIC TRADING PROGRAM WHICH CANNOT BE FULLY ACCOUNTED FOR IN THE PREPARATION OF HYPOTHETICAL PERFORMANCE RESULTS AND ALL OF WHICH CAN ADVERSELY AFFECT ACTUAL TRADING RESULTS.