What Did OPEC+ Decide This Month?
The OPEC+ group’s Joint Ministerial Monitoring Committee (JMMC) met on Monday (4/3/2023) and surprisingly decided to cut oil production even more. Major oil-producing countries, including Russia, agreed to decrease production by an additional 1.66 million barrels per day, adding to the cuts already in place since November last year.
Tell Me More
Before the meeting, people thought nothing newsworthy would happen, but the announcement of these cuts caused oil prices to jump over 6% on Monday (4/3/23), with West Texas Intermediate (WTI) Crude going above $80 a barrel again. The meeting confirmed the voluntary cuts by Saudi Arabia, Iraq, United Arab Emirates, Kuwait, Kazakhstan, Algeria, Oman, and Gabon, which will take effect from May until the end of 2023.
Amena Bakr, an expert at Energy Intelligence, reported that other OPEC+ countries are also being encouraged to join these voluntary production cuts.
So, What Does This Mean for WTI Crude Oil Prices?
Well, it reduces supply amid relatively high demand. Analysts are now warning that oil could reach $100 per barrel. In just a matter of hours after the announcement, the additional production cuts of 1.66 million barrels per day have led to a 6% jump in oil prices and West Texas Intermediate (WTI) Crude surpassing $80 a barrel. The ongoing reduction in supply may push oil prices even higher, potentially reaching the $100 per barrel mark.
What Does the Technical Picture Look Like Right Now?
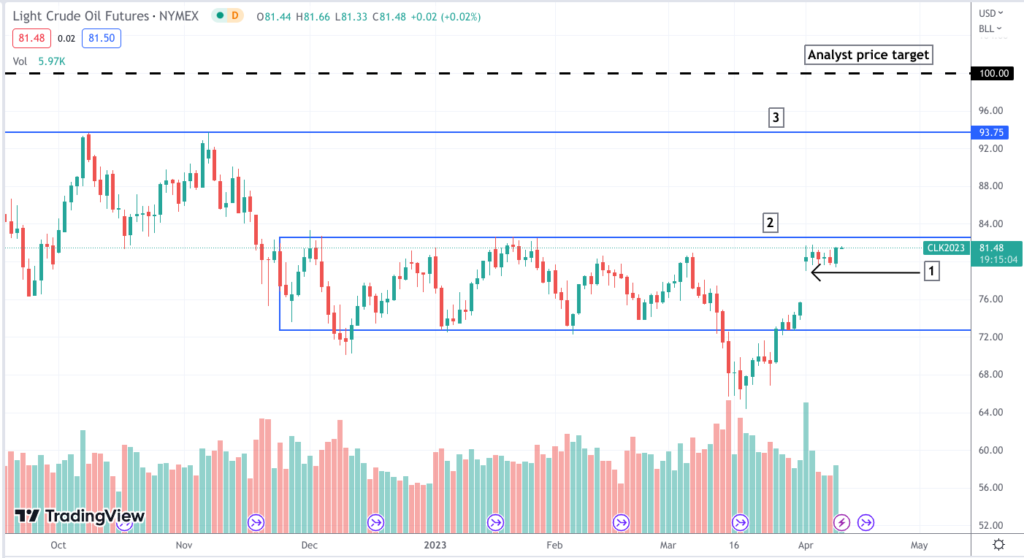
WTI Crude (CL) – Daily – September 22, 2022 – April 11, 2023 (Source: Tradingview)
- Overnight trading on 4/3/23 saw a breakaway gap at [1]. The question now is whether the gap will be filled (as many gaps are often retested). Watch the volume here to see whether any follow through is supported by bullish buying pressure. You might also want to check out the Chaikin Money Flow and Accumulation/Distribution indicator to get another angle on buying pressure.
- You can clearly see the rectangle pattern that the price broke below in mid-March at [2]. So, you can see an area of resistance ahead of oil’s path.
- There’s another area of resistance at [3] which was tested twice in October and November last year.
- Finally, you can see several analyst price targets at [4]. $100 a barrel.
The Bottom Line
There’s quite a distance between where the CL is now and where many analysts are expecting it to go. You can also see the technical picture which should help you identify potential entry points and technical resistance points. You’ll have to weigh these against the fundamental and geopolitical data that’s likely to swarm the headlines and market sentiments in the weeks to months ahead.
There are many ways to trade this, if you choose to do so, using futures and/or options (on futures).
Here you have it: a technical map of what may potentially unfold in the near future and the fundamental expectations on Wall Street. Now it is your turn as the trader to analyze and decide how this information may affect your trading plan.
Please be aware that the content of this blog is based upon the opinions and research of GFF Brokers and its staff and should not be treated as trade recommendations. There is a substantial risk of loss in trading futures, options and forex. Past performance is not necessarily indicative of future results.
Disclaimer Regarding Hypothetical Performance Results: HYPOTHETICAL PERFORMANCE RESULTS HAVE MANY INHERENT LIMITATIONS, SOME OF WHICH ARE DESCRIBED BELOW. NO REPRESENTATION IS BEING MADE THAT ANY ACCOUNT WILL OR IS LIKELY TO ACHIEVE PROFITS OR LOSSES SIMILAR TO THOSE SHOWN. IN FACT, THERE ARE FREQUENTLY SHARP DIFFERENCES BETWEEN HYPOTHETICAL PERFORMANCE RESULTS AND THE ACTUAL RESULTS SUBSEQUENTLY ACHIEVED BY ANY PARTICULAR TRADING PROGRAM.
ONE OF THE LIMITATIONS OF HYPOTHETICAL PERFORMANCE RESULTS IS THAT THEY ARE GENERALLY PREPARED WITH THE BENEFIT OF HINDSIGHT. IN ADDITION, HYPOTHETICAL TRADING DOES NOT INVOLVE FINANCIAL RISK, AND NO HYPOTHETICAL TRADING RECORD CAN COMPLETELY ACCOUNT FOR THE IMPACT OF FINANCIAL RISK IN ACTUAL TRADING. FOR EXAMPLE, THE ABILITY TO WITHSTAND LOSSES OR TO ADHERE TO A PARTICULAR TRADING PROGRAM IN SPITE OF TRADING LOSSES ARE MATERIAL POINTS WHICH CAN ALSO ADVERSELY AFFECT ACTUAL TRADING RESULTS. THERE ARE NUMEROUS OTHER FACTORS RELATED TO THE MARKETS IN GENERAL OR TO THE IMPLEMENTATION OF ANY SPECIFIC TRADING PROGRAM WHICH CANNOT BE FULLY ACCOUNTED FOR IN THE PREPARATION OF HYPOTHETICAL PERFORMANCE RESULTS AND ALL OF WHICH CAN ADVERSELY AFFECT ACTUAL TRADING RESULTS.