On its most basic level, the Relative Strength Index (RSI) is a momentum indicator that can be used to forecast potential “overbought” and “oversold” levels. But like most indicators forecasting price levels that are either too high or too low, there’s a lag time between price “over-extension” and its actual reversal (assuming that the reading was correct).
This lag time presents traders with a short-term possible opportunity, and the RSI can be used to help identify these potentially tradable moments.
Using the 5-Day RSI
The RSI has a standard default setting of 14 days. A fourteen-day reading can help measure intermediate-term trend activity. If we use a short-term RSI, such as 5 days, we may be able to capture shorter-term trends – keep in mind that, in the big picture, this may also include more “market noise.”
And taking advantage of market noise is what we’re about to discuss. Here’s the basic idea:
RSI levels range from 0 to 100. Generally, levels beyond the 70 range tend to be considered potentially overbought, meaning that price may eventually pull back, and the reverse is assumed for levels below 30 (that price may eventually rise).
Aside from these basic technical principles, there are larger factors at work that may present opportunities:
- Trends are fundamentally driven by factors such as: business activity, interest rates, and changes in the global economy.
- When an index fund’s price is “overbought” in a strong uptrend, its fundamental structure doesn’t necessarily change (it’s still in an uptrend).
- Most importantly, when an index fund reaches overbought levels in a strong bull market, there’s often a lag between its rise in price and its pullback–and this is the scenario that the following tactic aims to exploit.
The Short-Term Lag Between Rise and Fall
S&P 500 Futures (ES) Daily Chart – May 14, 2019 to January 17, 2020
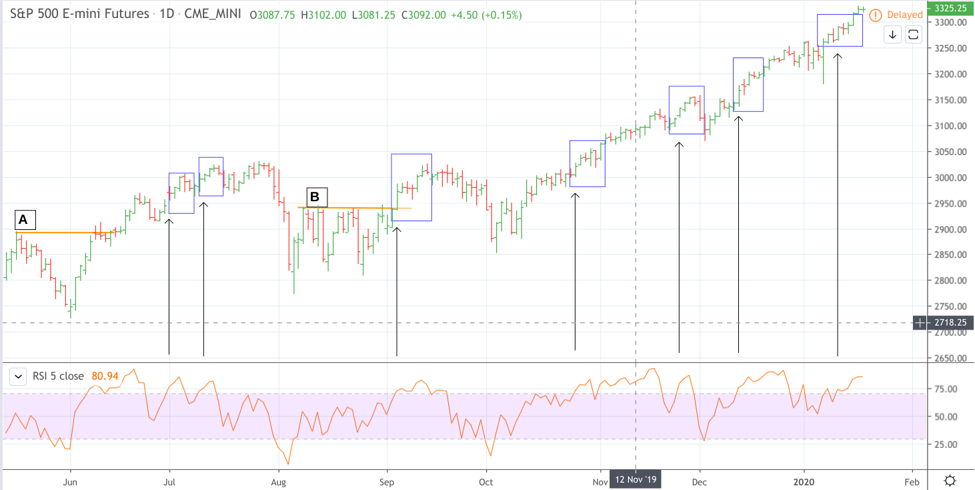
Let’s evaluate the chart above.
The long-term uptrend in the S&P 500 appears to be fundamentally intact. There is no economically-driven indication that the bull market has ended. And until signs of recession become overwhelmingly present, there’s no reason to assume anything other than a continuation of the bull market.
Note that in each instance when the intermediate-term uptrend has been confirmed (meaning, that price is exhibiting higher highs and higher lows, or that a temporary pullback has been violated by a breakout as illustrated in breakouts A and B ) that an RSI reading above 70 is usually followed by 5 days of upward movement.
In some cases, prices continue upward despite its “overbought” reading. In other cases, price pulls back temporarily. Taking advantage of this temporary lag time between an overbought RSI reading and its forecasted pullback is the main idea behind this trading tactic.
Trading Setup
The setup we’re about to layout can work for a variety of different markets. That said, the index funds may be a highly compatible choice for two main reasons, because: (1) indexes are generally more liquid markets and (2) fundamental information is very accessible and widely covered in financial media. If you are considering testing this setup, you may want to consider starting with Micro E-mini Index Fund Futures since the dollar-per-point risk may be much smaller than the regular E-minis.
Here’s how this particular trade setup works:
- If the index fund is currently in an uptrend (in other words, not undergoing a pullback or correction), wait for the 5-day RSI to exceed the level of 70.
- If the RSI exceeds 70, go long at the end of the day while placing a stop at the nearest swing low.
- Hold the position for a maximum of five trading days then exit at the close.
The trade seems quite simple, and it is. Remember, you’re simply seeking to exploit the lag between an overbought reading and the potential price reversal that may follow. You can play around with this trading tactic, customizing it to suit your own approach, but generally, the concept is simple.
Remember that not all trading systems yield consistently profitable results. So back test and forward test it before using it in the live market. It may be a simple system, but simpler systems can prove to be more robust. So if you decide to adopt this approach, do it wisely and make sure that it fits within your own trading approach.
Please be aware that the content of this blog is based upon the opinions and research of GFF Brokers and its staff and should not be treated as trade recommendations. There is a substantial risk of loss in trading futures, options and forex. Past performance is not necessarily indicative of future results.
Be advised that there are instances in which stop losses may not trigger. In cases where the market is illiquid–either no buyers or no sellers–or in cases of electronic disruptions, stop losses can fail. And although stop losses can be considered a risk management (loss management) strategy, their function can never be completely guaranteed.
Disclaimer Regarding Hypothetical Performance Results: HYPOTHETICAL PERFORMANCE RESULTS HAVE MANY INHERENT LIMITATIONS, SOME OF WHICH ARE DESCRIBED BELOW. NO REPRESENTATION IS BEING MADE THAT ANY ACCOUNT WILL OR IS LIKELY TO ACHIEVE PROFITS OR LOSSES SIMILAR TO THOSE SHOWN. IN FACT, THERE ARE FREQUENTLY SHARP DIFFERENCES BETWEEN HYPOTHETICAL PERFORMANCE RESULTS AND THE ACTUAL RESULTS SUBSEQUENTLY ACHIEVED BY ANY PARTICULAR TRADING PROGRAM.
ONE OF THE LIMITATIONS OF HYPOTHETICAL PERFORMANCE RESULTS IS THAT THEY ARE GENERALLY PREPARED WITH THE BENEFIT OF HINDSIGHT. IN ADDITION, HYPOTHETICAL TRADING DOES NOT INVOLVE FINANCIAL RISK, AND NO HYPOTHETICAL TRADING RECORD CAN COMPLETELY ACCOUNT FOR THE IMPACT OF FINANCIAL RISK IN ACTUAL TRADING. FOR EXAMPLE, THE ABILITY TO WITHSTAND LOSSES OR TO ADHERE TO A PARTICULAR TRADING PROGRAM IN SPITE OF TRADING LOSSES ARE MATERIAL POINTS WHICH CAN ALSO ADVERSELY AFFECT ACTUAL TRADING RESULTS. THERE ARE NUMEROUS OTHER FACTORS RELATED TO THE MARKETS IN GENERAL OR TO THE IMPLEMENTATION OF ANY SPECIFIC TRADING PROGRAM WHICH CANNOT BE FULLY ACCOUNTED FOR IN THE PREPARATION OF HYPOTHETICAL PERFORMANCE RESULTS AND ALL OF WHICH CAN ADVERSELY AFFECT ACTUAL TRADING RESULTS.