You’ve entered a short position in the market, and your underlying asset is now tanking. As a short seller, this is good news, as the profitability of your position grows the farther your asset falls in price.
But now you’re faced with another question: how long might you let your profits run? If “pigs get slaughtered,” as the saying goes, at what point might your profits be entering glutton territory?
Perhaps you have a percentage or dollar-based target: “I want to make 5% on this trade,” or, “I would like to make $1,000,” for instance. But why 5%? Why $1,000? If you have a good reason for these figures, then, maybe you have your answer.
But often times, traders who set these kinds of limits don’t have a solid reason for these figures. In many cases, traders might not know whether their profit targets are too tight or too loose. Sound familiar? If it does, then read on.
Perhaps you can use an objective means to set your short-sell profit targets. Note that we said “objective.” We didn’t say accurate, nor predictive, nor the best possible target. Just objective. And oftentimes, objective is good enough, because you can measure it; working off a reference point instead of a vague gut feeling.
Here are two tactics to consider:
Using Previous Support (the “Memory” of the Markets)
The logic behind this is rather simple. When enough buyers jump in at around the same price level and same time, the asset’s price tends to rise as buyers are willing to pay higher prices, bidding up the asset.
Buying en masse can be identified more easily at breakouts from resistance or at price surges near or at support. We’ll focus on support, as these level can sometimes serve as target from which to expect a potential price bounce upwards.
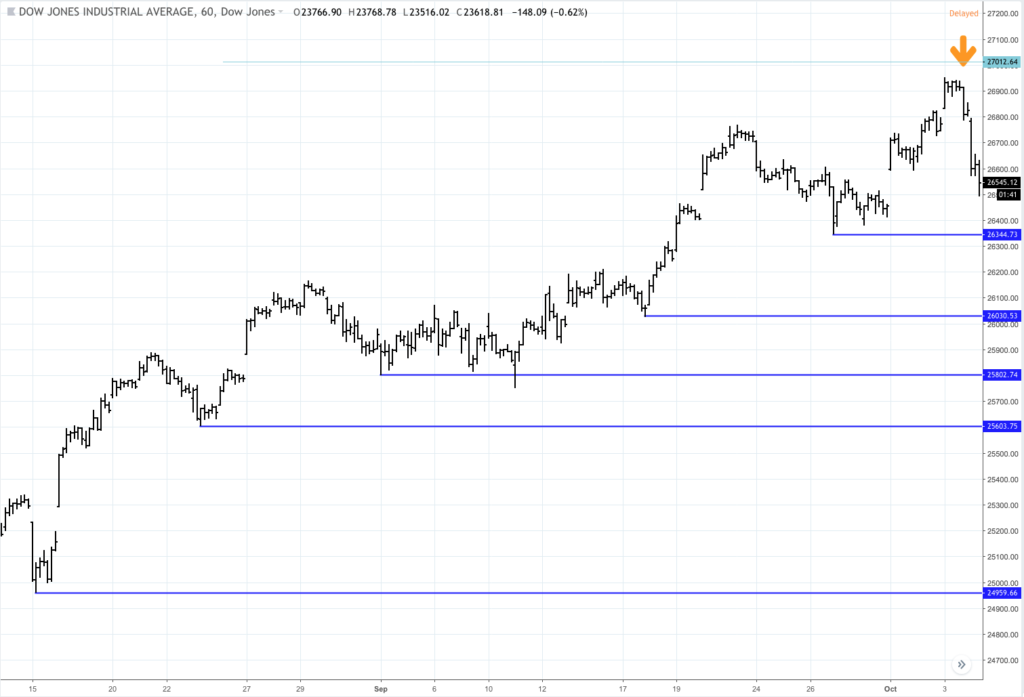
Dow Jones August 14 to October 4, 2018
Suppose you went short anywhere near the yellow down arrow.
- Might any of the previous support levels serve as potential downside targets?
- Might any of the levels have resulted in a price bounce?
Let’s advance the chart and take a look at what had happened.
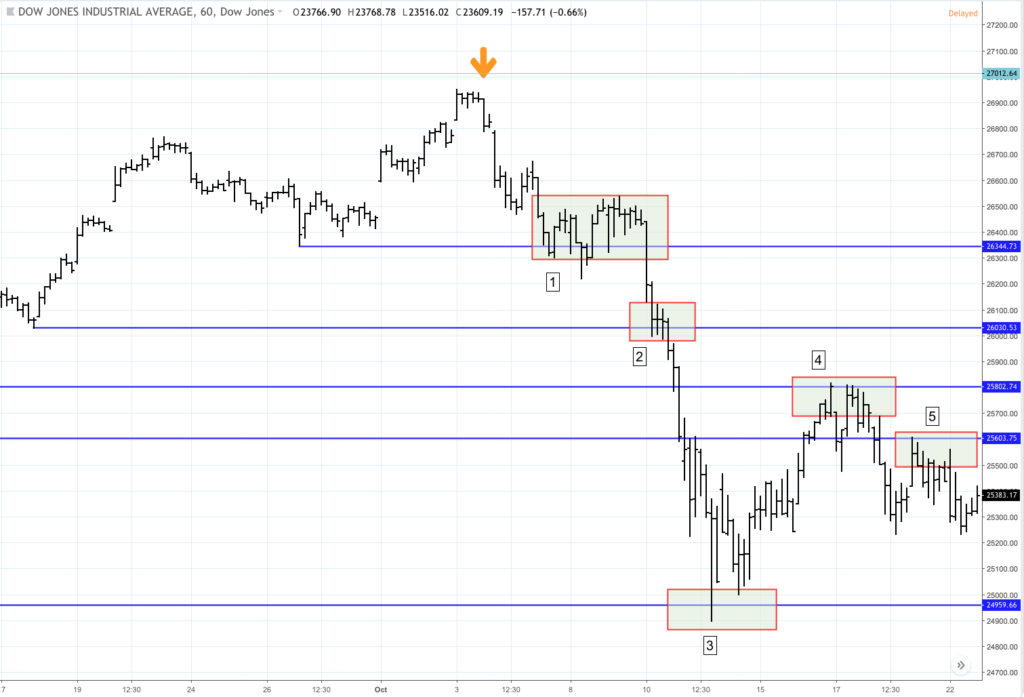
Dow Jones September 12 to December 19, 2018
As you can see, support at (1) marked a short consolidation range in which bulls might have attempted to pushed price back above toward previous highs. That would have been a conservative price target for any short seller. Note that as soon as that support broke, more sellers began entering the markets.
Support at (2) showed very little response other than the indecisive bar (what appears as a Doji pattern if we were looking at candlesticks) that happened the day after the support level was hit. It appears as if there was uncertainty with regard to direction immediately after the bounce back. Closing your short position at this level would have worked, but you would also have missed a much longer trend.
As this swing began picking up steam, buyers who were on the sidelines were trying to figure at what point they should jump into the markets. Sellers, on the other hand, were trying to decide on where to close out their short trades.
The support level dating back to August 15, 2018 at (3) served as a reference point for both buyers and short sellers. As you can see, there was a bounce from that particular price level. For anyone who was short, (3) may have appeared as a very strong target, as any support below that would have been gone further back in time, at which point you might wonder whether “market memory” (or the memory of those who bought at the time( would have made much of a difference.
We’re pointing out (4) and (5) not because these previous support levels prompted any buying but because they served as resistance. You’re probably aware of the popular technical analysis assumption that resistance, once broken, tends to become support; and support, once broken, tends to become resistance.
The main takeaway here is that previous support levels may hold. If the market has a “memory,” it’s because buyers may still be holding positions from a previous level wherein a large number of participants happened to buy en masse; or that new buyers, having identified these potentially “critical” levels, have decided to jump in en masse.
Caveat: But what if previous support levels are no longer relevant? Or, what if the current down trend, breaching record lows, sees no support recent enough to rely on?
In that case you may need different tactics to determine a reasonable short profit target. One such tactic is the “measured move.” We’ll cover this in Part II of our two-part series.
Please be aware that the content of this blog is based upon the opinions and research of GFF Brokers and its staff and should not be treated as trade recommendations. There is a substantial risk of loss in trading futures, options and forex. Past performance is not necessarily indicative of future results.
Disclaimer Regarding Hypothetical Performance Results: HYPOTHETICAL PERFORMANCE RESULTS HAVE MANY INHERENT LIMITATIONS, SOME OF WHICH ARE DESCRIBED BELOW. NO REPRESENTATION IS BEING MADE THAT ANY ACCOUNT WILL OR IS LIKELY TO ACHIEVE PROFITS OR LOSSES SIMILAR TO THOSE SHOWN. IN FACT, THERE ARE FREQUENTLY SHARP DIFFERENCES BETWEEN HYPOTHETICAL PERFORMANCE RESULTS AND THE ACTUAL RESULTS SUBSEQUENTLY ACHIEVED BY ANY PARTICULAR TRADING PROGRAM.
ONE OF THE LIMITATIONS OF HYPOTHETICAL PERFORMANCE RESULTS IS THAT THEY ARE GENERALLY PREPARED WITH THE BENEFIT OF HINDSIGHT. IN ADDITION, HYPOTHETICAL TRADING DOES NOT INVOLVE FINANCIAL RISK, AND NO HYPOTHETICAL TRADING RECORD CAN COMPLETELY ACCOUNT FOR THE IMPACT OF FINANCIAL RISK IN ACTUAL TRADING. FOR EXAMPLE, THE ABILITY TO WITHSTAND LOSSES OR TO ADHERE TO A PARTICULAR TRADING PROGRAM IN SPITE OF TRADING LOSSES ARE MATERIAL POINTS WHICH CAN ALSO ADVERSELY AFFECT ACTUAL TRADING RESULTS. THERE ARE NUMEROUS OTHER FACTORS RELATED TO THE MARKETS IN GENERAL OR TO THE IMPLEMENTATION OF ANY SPECIFIC TRADING PROGRAM WHICH CANNOT BE FULLY ACCOUNTED FOR IN THE PREPARATION OF HYPOTHETICAL PERFORMANCE RESULTS AND ALL OF WHICH CAN ADVERSELY AFFECT ACTUAL TRADING RESULTS.