When you’re day trading the markets, you’re looking to take advantage of micro supply and demand levels. Longer-term investors call this “market noise,” or fluctuations that may have no significance in the larger fundamental scale of things. But for day traders and scalpers, volatile micro movements signal opportunities for potential profit as well as the risk of loss.
Fortunately, market patterns do tend to recur, and can be identified (and anticipated) fairly easily. The thing is, you can’t predict the outcome. But with proper risk management, you might prevent yourself from getting dinged when the market turns against you while seeking a much larger return should the market move your way.
Here are four frequently occurring patterns that you might see on an almost daily basis. To be clear, you might not see them every day, but they tend to show up frequently enough to expect them.
1 – Continuation of an Impulse Wave
If a market trends in a given direction, the impulse wave is the first strong move in the direction of a trend. Typically, you’ll see an impulse wave, a pullback, and a continuation in the direction of the impulse wave. If you’re trading any of the major US stock indexes, this impulse typically occurs a few minutes after the stock market’s opening bell.
Dow Jones Futures (YM) – 5-Minute Chart – January 24. 2022 (source Tradingview)
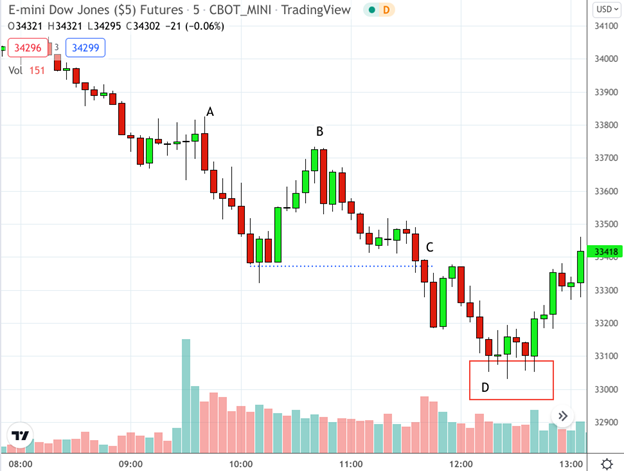
The market opens at [A] and the YM takes a dive. If we were to call this movement a micro-trend, then this initial drop is the “impulse wave.” The market pulls up significantly at [B] but fails to take out the high. At this point, a day trader may be looking for a breakout at [C]. As price breaks below that level, a trader might have placed a market order to go short, with a target to close the position at 32929 (a measured move of the impulse wave—448 points—from the breakout at [C] to its target at [D]. The Dow gets close to the target price, but instead of hitting it, the Dow floats about it, establishing support. Hopefully, the day trader knows to exit the position while the majority of the profits are still in place.
2 – Impulse and Reversal
Strong impulse waves don’t always determine the direction of the market. Sometimes they’re followed by abrupt reversals as in the example below.
Bitcoin Futures (BTC) -1 5-Minute Chart – January 13. 2022 (source Tradingview)
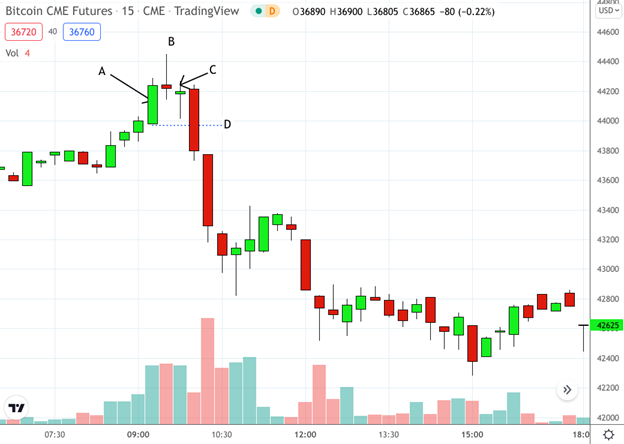
BTC likely responded to the stock market’s opening bell. There you see a strong bullish move [A]. In the 15 minutes following it, however, you see strong price rejection at [B] above 4440. In the following bar, you see support at [C] as buyers rush in. But ultimately, the price couldn’t penetrate the levels above the previous bar. So, BTC begins to tumble, breaking the opening level at [D] that marked the initial impulse move upwards. A day trader might have taken this breakout as a sign to go short. If so, the trader could have ridden the market down for the next several hours as BTC continued coasting downward following its steep drop.
3 – Support and Resistance Reversals
Short-term reversals at support and resistance are a common daily occurrence, especially when using small timeframes. Because there’s nothing to indicate how long a micro-swing will last, as moves on this scale don’t reflect longer-term fundamentals of technicals, some traders prefer to stick with support and resistance to determine targets and stop loss levels.
Gold Futures (GC) – 5-Minute Chart – January 24. 2022 (source Tradingview)
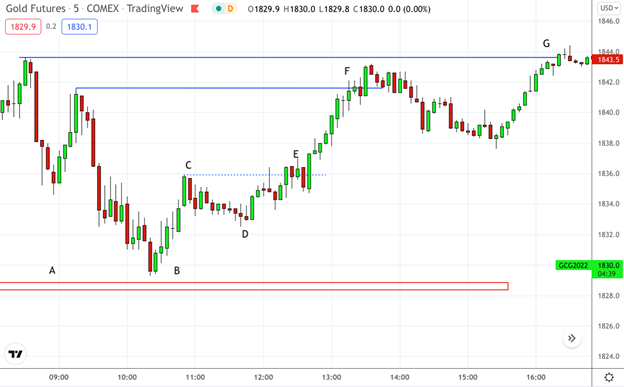
Gold declined as the stock market opened on Monday, January 24, 2022. Support at [A] was established in the previous session, Friday. The range was tested twice before buyers stepped in to lift the gold prices. Traders, seeing this as an opportunity to go long, jumped in at [B], causing price to lift. Some traders might have taken profits at [C] as it neared the halfway point between the last swing high and low, but the upward reversal at [D] revealed that bullish traders might have seen this as an opportunity to go long at the 50% Fib retracement between [B] and [C]. Price broke out at [E] and two potential profit targets at [F] and [G] matched the previous highs before the reversal at [B]. Do you follow the action?
4 – Fibonacci Retracements
When ultra-short term traders are looking for market entries and exits, support and resistance levels play a critical role. But what if they’re looking to get in or out at levels between support and resistance? That’s what Fibonacci retracements are for; and on a short time frame, these levels abound.
WTI Crude Futures (CL) – 5-Minute Chart – January 26. 2022 (source Tradingview)
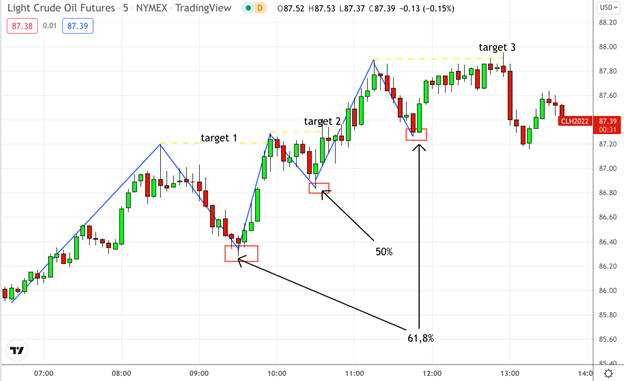
Crude oil futures shot up on January 26, weaving its way up before reversing at an 8-year high. This is what it looks like on the 5-minute chart. Arguably, this was a trending day. So how might traders have entered the CL market while it was trending strongly? Note the 61.8% and 50% Fib retracements. Both levels make for anticipatable entries. For day traders, previous swing highs (see targets 1 – 3) also make for easy and identifiable exits. You can find Fib patterns on an almost-daily basis, making them an easy setup to identify and trade. Not all retracements will work out, but their frequent occurrences make for ample opportunities to trade the ones that do.
The Bottom Line
Unlike longer-term chart patterns, these setups occur frequently. If you can learn to identify them, trade them, and prepare for varying outcomes—win or loss—in a way that helps you optimize your profits and limit your risks, then you’ll have plenty of more opportunities to trade. Day trading isn’t for everyone, so be sure you have the interest, time, resources, and tolerance to handle the volatility that often comes with it.
Please be aware that the content of this blog is based upon the opinions and research of GFF Brokers and its staff and should not be treated as trade recommendations. There is a substantial risk of loss in trading futures, options and forex. Past performance is not necessarily indicative of future results.
Disclaimer Regarding Hypothetical Performance Results: HYPOTHETICAL PERFORMANCE RESULTS HAVE MANY INHERENT LIMITATIONS, SOME OF WHICH ARE DESCRIBED BELOW. NO REPRESENTATION IS BEING MADE THAT ANY ACCOUNT WILL OR IS LIKELY TO ACHIEVE PROFITS OR LOSSES SIMILAR TO THOSE SHOWN. IN FACT, THERE ARE FREQUENTLY SHARP DIFFERENCES BETWEEN HYPOTHETICAL PERFORMANCE RESULTS AND THE ACTUAL RESULTS SUBSEQUENTLY ACHIEVED BY ANY PARTICULAR TRADING PROGRAM.
ONE OF THE LIMITATIONS OF HYPOTHETICAL PERFORMANCE RESULTS IS THAT THEY ARE GENERALLY PREPARED WITH THE BENEFIT OF HINDSIGHT. IN ADDITION, HYPOTHETICAL TRADING DOES NOT INVOLVE FINANCIAL RISK, AND NO HYPOTHETICAL TRADING RECORD CAN COMPLETELY ACCOUNT FOR THE IMPACT OF FINANCIAL RISK IN ACTUAL TRADING. FOR EXAMPLE, THE ABILITY TO WITHSTAND LOSSES OR TO ADHERE TO A PARTICULAR TRADING PROGRAM IN SPITE OF TRADING LOSSES ARE MATERIAL POINTS WHICH CAN ALSO ADVERSELY AFFECT ACTUAL TRADING RESULTS. THERE ARE NUMEROUS OTHER FACTORS RELATED TO THE MARKETS IN GENERAL OR TO THE IMPLEMENTATION OF ANY SPECIFIC TRADING PROGRAM WHICH CANNOT BE FULLY ACCOUNTED FOR IN THE PREPARATION OF HYPOTHETICAL PERFORMANCE RESULTS AND ALL OF WHICH CAN ADVERSELY AFFECT ACTUAL TRADING RESULTS.
GFF Brokers is a member of NFA and is subject to NFA’s regulatory oversight and examinations. However, you should be aware that NFA does not have regulatory oversight authority over underlying or spot virtual currency products or transactions or virtual currency exchanges, custodians or markets.
Notice from CFTC: Customer Advisory: Understand the Risks of Virtual Currency Trading
Notice from NFA: NFA Investor Advisory—Futures on Virtual Currencies Including Bitcoin