Many retail traders have been asking this question for quite a few months. “Should I short the market; isn’t it overvalued; might the market be reflecting ‘irrational exuberance’”? It’s time to address this question, as the question itself necessitates answers to many other smaller questions. So, let’s get to it.
What’s Your Short-Sale Time Horizon?
First off, when people refer to “the market,” they’re likely talking about the major US indexes–the ES, YM, NQ, and less often the RTY. So, we’ll limit the scope of this article to these.
If you’re talking about a short sale lasting a matter of days, mostly based on technicals, then go ahead and do what you typically do; no need to ask whether you should go short or long. Markets go up and down on a daily basis. But if you’re looking for a meaningful context to your trade–like a prolonged reason to have a short bias–then read on.
One of the first things that most new futures traders learn to do is plot a trend line and use basic indicators to measure trends. We’re going to go beyond just looking at trend lines and explore more of the bigger picture of what they mean.
Which Market Are You Thinking About?
Although the YM, ES, NQ, and RTY are all correlated, they’re still different markets. Some may rise lower (or higher) than others. We are going to look at 2 of these: RTY & NQ.
YM, ES, NQ, and RTY Daily Chart – January 2020 to March 09, 2021 (source: Tradingview)
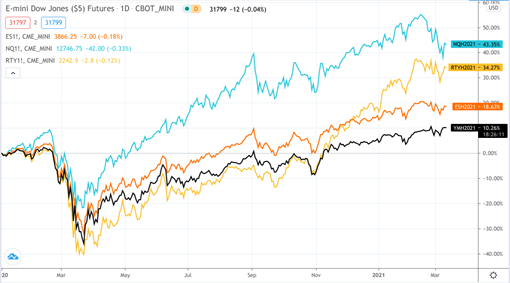
RTY
RTY underperformed most of 2020, but started rising at the end of the year in November. Is this a reason not to go short the index? Possibly. But note that insider selling is alarmingly high among small caps.
NQ
The NQ is a tech-heavy index. But even within the tech sector, there are five industries. Three of them, software, hardware, and semiconductors have been top performers throughout 2020.
Now, take a look at those three industries. Only one is generally viewed as a longer-term economic barometer, and it has important implications for every other major US-based broad market index: semiconductors.
Why is that? Because it takes about a full year for a chipmaker to produce its product. So, the general view is that if semiconductors are going up, then analysts might be bullish on the economy; the opposite case is assumed if chips are going down. But again, semiconductors have seen a huge supply shortage due to trade war and pandemic disruptions. Although chipmakers might continue to rise due to cost-push inflation, the same can’t be said for the tech sector overall.
We won’t get into the details of the other indexes, simply because there’s too much to cover.
But here’s our main point: every index has not only its own unique attributes, but it can also tell you a lot about the other indexes, markets, and the overall economy. And this should inform your longer-term bias.
The Big Question About the Market Hinges on the Conflict Between Two Worlds
Are you bullish or bearish? Is the market overvalued or undervalued? Should you go short or long?
The following is a list of thoughts/concepts you should consider when trying to assess the situation and make a decision regarding your position on the markets.
There’s been plenty of talk about the market being overvalued; the market being disconnected from the economy. If anything this tells you there are two economies: the financial economy of Wall Street which is more directly affected by the Federal Reserve’s easing policies, and the “real” economy of Main Street which is made up of all the businesses–particularly small ones–that you see in your neighborhood.
The conflict between the financial and real economy is always playing out, particularly amid the Covid-19 pandemic, wherein quantitative easing and fiscal spending may cause stock market prices to rise while the economy remains challenged.
If financial institutions are calling for a crash due to markets being “overvalued,” we can understand that. However, you have to pay attention to subtle clues–one being the Chairman of the Federal Reserve, Jerome Powell’s statement last on February 10th that the “real” unemployment rate is closer to 10% and that the Bureau of Labor and Statistics’ figure of 6.3% was a miscalculation.
What does that mean? It means that the slack in labor may allow for greater inflation as companies have plenty of unemployed “reserves” to hire. If the labor markets were tight during a period of high inflation, then rising consumer prices would prompt workers to demand higher wages. Companies would have to pass on that higher cost (to satisfy wage demands) to consumer products which in turn causes workers to demand even higher wages to keep up with the cost of living. We saw this in the 1970st’s a vicious spiral.
But with a slackened labor market, there’s room to inflate. What might this mean? It can mean that stock prices may have room for growth despite their overvalued levels because quantitative easing may end up “backstopping” the markets. Now, do you really want to short the market?
The Bottom Line
These are just a few clues to pay attention to when considering a position in market direction. It’s more than a technical scope, or even a fundamental scope for that matter. It’s more like detective work, where the most important clues may be in the most subtle and inconspicuous details or traces of market activity.
Please be aware that the content of this blog is based upon the opinions and research of GFF Brokers and its staff and should not be treated as trade recommendations. There is a substantial risk of loss in trading futures, options and forex. Past performance is not necessarily indicative of future results.