Like any other form of speculation, swing trading can never guarantee success. It can give you exposure to more frequent opportunities than long-term investing, and it might give you more time to plan your trades using both technical and fundamental data than, say, day trading, but besides exposure and frequency, it doesn’t guarantee your chances of success.
And this may be a reason to take advantage of the relatively slower pace that swing trading offers, by taking time to carefully observe the technical and fundamental environment that can shape your market of choice.
Case in point: Gold. Spot gold reached its 2018 peak of 1366 in January. Toward the end of 2017, as the markets and investing public were seemed overly-focused on the unprecedented surge of cryptocurrencies, Bitcoin having reached almost $20,000 per coin, there were many comparisons between gold and Bitcoin; on whether the latter may have usurped the former’s “safe haven” status.
This might have distracted traders from one of the more important factors affecting gold’s price: the US dollar. In light of the increasing financial turmoil in emerging markets and the slow but steady deterioration in the US non-financial (corporate) credit markets, the greenback began to strengthen, signaling a possible opportunity to go short the yellow metal.
Let’s look at the technical indications starting in January through mid July.
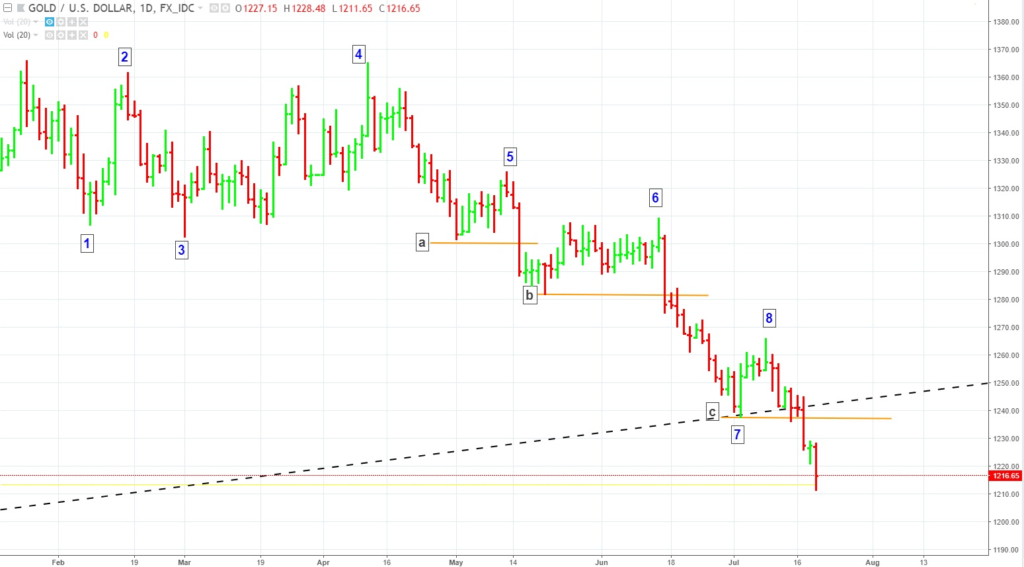
Gold Spot Daily Chart January 19 to July 19, 2018
Following gold’s peak on January 25, the metal declined at (1), hitting a low of 1307 on February 8. This, in itself, did not signal anything other than a potential reaction; a mere pause, as we were still in a technical uptrend.
But then at (2), we noticed that gold was unable to break through its previous highs. This indicates that a change in trend may be underway. If price can’t break through a previous swing high point, and if it fails to close below the previous swing low, then it may be signaling a trading range.
And this is what happened at (3); price violated but failed to close below the previous swing low. Gold continued fluctuating within this range, failing again to break above the January high at (4).
But then, something interesting happens at (5). Gold never made it to the halfway point of the range until it began to reverse. And this is where the first price action-based opportunity to go short might have been spotted.
Given that a downtrend hadn’t yet been established, traders who were willing to take a more aggressive approach might have wanted to place a sell stop at (a) with a stop loss above the high at (5).
Gold broke below (a) and began consolidating for the next 22 days. But more importantly, this break below indicated the beginning of a down trend.
Given the top of the consolidation range at (6), the next short trade might have been placed at the recent swing low at (b). Remember, we are now in a technical downtrend, which means we are anticipating lower lows as well as lower highs.
Price breaks below (b) and establishes another swing low point at (7), from which it bounces. Now here is a shining example of why a long-term perspective might be helpful. Why did buyers jump in at (7)? What were some of them anticipating?
Buyers came in around this price level because it converged with “support” from the long-term uptrend line staring in 2015.
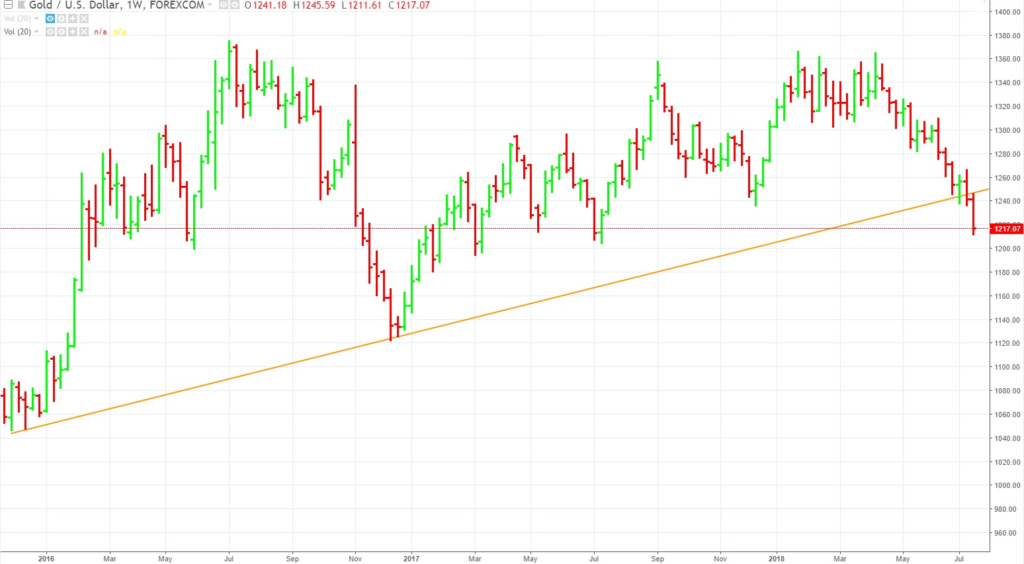
Spot Gold Weekly Chart November 23, 2015 to July 19, 2018
Despite this critical support level, however, it wasn’t enough to buck the trend, as price, far from taking out (6), began reversing at (8). The swing low at (7) becomes yet another short trigger as shown at (c).
Now gold has broken below critical support. The closest support lines we can find all took place in 2016 or before it.
Going short at this point, at least from a technical perspective, is quite scary, as you cannot find a recent price point that may serve as a profit objective. But going long is just as uncertain, as we have no technical justification to be bullish.
Now is the time to look at fundamental forecasts for a more strategic outlook. We know that BAML’s (Bank of America Merrill Lynch) recent forecast, a strange one at that, projects both the US Dollar AND gold reaching new highs by the end of 2018. The dollar and gold typically move inverse to one another. Why this strange inversion of an inversion? Emerging markets, inflation, higher interest rates, and deteriorating credit markets may drive investors out of stocks and into both the dollar and gold for safety.
Might this forecast come to fruition? We don’t know. But we will continue to look at the technical setups to see if any opportunities, whether short- or long-term, present themselves.
Please be aware that the content of this blog is based upon the opinions and research of GFF Brokers and its staff and should not be treated as trade recommendations. There is a substantial risk of loss in trading futures, options and forex. Past performance is not necessarily indicative of future results.