Volatility trading isn’t for everybody. But for those who want to ride the rollercoaster, it’s certainly a way to potentially take advantage of markets that are moving quickly. By keeping an eye on those big price swings using volatility indicators and other cool technical analysis tools, traders might be able to spot an opportune moment to jump in or bow out of a trade.
This kind of trading really shines when the market’s all over the place due to uncertainty or big news events. But remember, with great opportunity comes great risk, so it’s super important to manage that risk and stick to your trading plan. After all, those wild markets can lead to big wins or losses, so staying on top of your game is key.
With that said, you might want to make use of volatility indicators to measure the risks and opportunities that a volatile environment may present.
What Are Volatility Indicators?
Volatility indicators are tools that help traders understand how much and how quickly the prices of assets, like stocks or currencies, are changing. These indicators show how stable or unstable the market is and help traders make informed decisions about buying or selling. By using volatility indicators, traders can get a better idea of the risks involved and potential opportunities in the market.
Here are ten volatility indicators to consider, depending on the market situation and your personal trading style.
1. Bollinger Bands 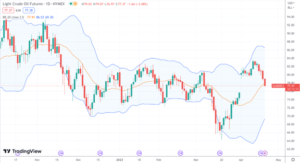
Bollinger Bands are a set of three lines plotted around a simple moving average, with the outer bands indicating standard deviation levels. When the bands contract, it suggests low volatility, and when they expand, it indicates increased volatility.
What makes the Bollinger Bands indicator effective
- Bollinger Bands excel in trending or range-bound market situations, aiding traders in pinpointing entry and exit points.
- They signify low volatility when bands contract, potentially foreshadowing a price breakout, and high volatility when bands expand, indicating trend continuation or exhaustion.
- These bands prove valuable for identifying reversals or breakouts and managing risks through proper stop-loss level settings.
2. Average True Range (ATR) 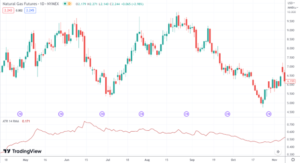
ATR measures the average range of price movement over a specified period, considering gaps and limit moves. It helps traders gauge the market’s volatility and set stop-loss orders accordingly.
What makes the ATR indicator effective
- ATR quantifies market volatility by considering the range of price movement, providing a comprehensive measure of volatility that captures intraday fluctuations and gaps.
- The indicator adapts to changing market conditions, offering real-time insights into volatility levels, which helps traders adjust their strategies and risk management accordingly.
- ATR is versatile and can be used in various trading contexts, such as setting stop-loss levels, determining appropriate position sizes, and identifying potential breakouts or trend reversals.
3. Volatility Index (VIX) 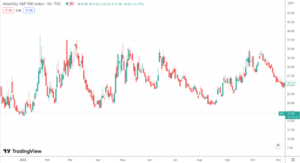
The VIX, also known as the “fear index,” is a measure of the implied volatility of S&P 500 index options. It represents the market’s expectation of 30-day forward-looking volatility, and a high VIX value indicates increased market uncertainty.
What makes the VIX indicator effective
- VIX serves as a real-time gauge of market sentiment, reflecting investors’ expectations of short-term volatility based on S&P 500 index options, making it a valuable tool for anticipating market movements.
- The index provides a useful hedging mechanism, allowing traders and investors to protect their portfolios against potential losses during periods of increased market volatility.
- VIX is often called the “fear index,” as it inversely correlates with market performance, making it a reliable contrarian indicator that can signal potential market reversals or shifts in sentiment.
4. Keltner Channels 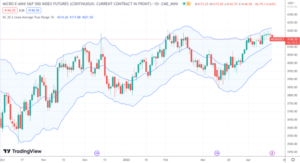
Similar to Bollinger Bands, Keltner Channels are volatility-based envelopes plotted around an exponential moving average. The distance between the channels is based on the Average True Range, and when the channels widen, it signals increased volatility.
What makes the Keltner Channels indicator effective
- Keltner Channels help identify trends and reversals by displaying a moving average with upper and lower bands, which are determined by average true range (ATR), providing a dynamic approach to measuring volatility.
- The channels offer valuable insights into potential overbought or oversold conditions, as prices nearing or crossing the channel boundaries can signal a potential trend reversal or continuation.
- Keltner Channels facilitate efficient risk management, enabling traders to set stop-loss levels and profit targets based on channel boundaries, which adapt to changing market volatility.
5. Donchian Channels 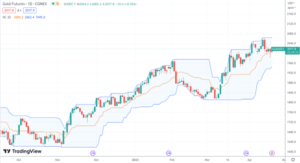
Developed by Richard Donchian, these channels are formed by plotting the highest high and the lowest low over a specified number of periods, typically 20. The width of the channel is an indicator of the asset’s volatility. When the channel narrows, it signals decreasing volatility, and when it widens, it indicates increasing volatility.
What makes the Donchian Channels indicator effective
- Donchian Channels visually represent the highest high and lowest low over a specified period, enabling traders to easily identify support and resistance levels, which are essential for volatility-based trading strategies.
- The channels help determine potential breakouts and trend reversals by tracking price movements beyond the upper or lower boundaries, offering valuable entry and exit points for traders.
- The simplicity and clarity of the channels make them an effective tool for both novice and experienced traders, as they can be combined with other technical indicators to enhance decision-making and risk management in volatility trading.
6. Chaikin Volatility Indicator 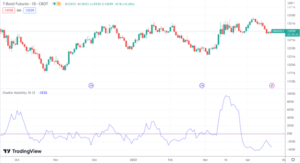
This indicator measures the difference between an asset’s high and low prices over a specified period, combined with its trading volume. A rise in the Chaikin Volatility Indicator suggests an increase in volatility, while a decrease indicates lower volatility.
What makes this indicator effective
- The Chaikin Volatility Indicator reflects the degree of price movement over time, helping traders to identify trends and potential reversals.
- The indicator highlights periods of increasing or decreasing volatility, offering insight into potential breakout or consolidation phases.
- Traders can adjust the look-back period and moving average type to suit their specific trading strategies and preferences.
7. RVI – Relative Volatility Index 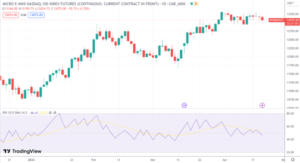
The Relative Volatility Index (RVI) is a technical analysis indicator that measures the direction and magnitude of a security’s price fluctuations over a specified period. Developed by Donald Dorsey, the RVI quantifies market volatility by comparing the standard deviation of up and down price movements to the overall standard deviation. Functioning as an oscillator, the RVI moves around a central level, helping traders identify overbought and oversold conditions, potential trend reversals, and confirming the strength of existing trends.
What makes the RVI indicator effective
- The RVI measures volatility by analyzing the standard deviation of price changes over a specified period, providing traders with a clear picture of market dynamics.
- As an oscillator, the RVI moves around a central level, enabling traders to identify overbought and oversold conditions that could signal potential trend reversals.
- The RVI can be used in conjunction with other technical indicators to confirm the strength and direction of a trend, improving trade entry and exit decisions.
8. Standard Deviation 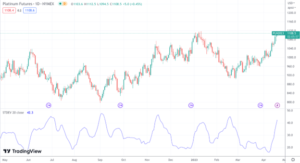
This is a basic statistical measure that quantifies the dispersion or variability of a dataset. In trading, it is applied to price data to measure the degree of price fluctuations over a specific period. A higher standard deviation indicates greater price volatility, while a lower value suggests more stable prices.
What makes the Standard Deviation indicator effective
- The indicator helps identify periods of extreme price movements by measuring how widely prices are spread, allowing traders to anticipate potential market reversals or the continuation of prevailing trends.
- Standard Deviation can be applied to various timeframes, providing flexibility for traders to analyze short-term or long-term volatility patterns, which can inform their trading decisions.
- The indicator’s adaptability enables it to be combined with other technical analysis tools, such as Bollinger Bands, enhancing the effectiveness of volatility-based trading strategies and improving the overall understanding of market behavior.
9. Chande Momentum Oscillator (CMO) 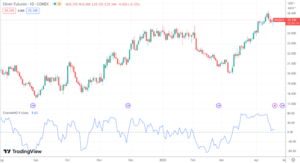
A momentum-based indicator by Tushar Chande, the CMO measures market volatility by comparing positive and negative price changes. Oscillating between -100 and 100, higher values indicate upward momentum and volatility, while lower values signal downward momentum and volatility. Use CMO alongside other technical indicators for market trend analysis and reversals.
What makes the CMO indicator effective
- CMO helps traders identify market trends by highlighting upward or downward momentum, enabling them to capitalize on periods of increased volatility.
- By observing CMO extremes, traders can detect potential trend reversals, offering entry or exit points during volatile market shifts.
- Combining CMO with other technical indicators enhances market analysis and strengthens trading signals, improving decision-making in volatile environments.
10. Historical Volatility (HV) 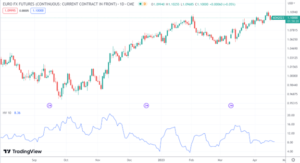
Historical Volatility is a statistical measure that quantifies the degree of variation in an asset’s price over a specified period. It is a widely used tool in finance, especially for options trading and risk management, as it helps traders and investors understand the potential price fluctuations of an asset.
What makes the HV indicator effective
- HV reveals past price fluctuations, aiding traders in anticipating future movements and spotting volatile market opportunities.
- Applicable to various timeframes, HV helps traders tailor strategies to match investment horizons and risk tolerance.
- Combining HV with other indicators creates robust trading strategies, enhancing market condition assessment, entry/exit point identification, and risk management.
The Bottom Line
Volatility trading can be a thrilling ride for traders who are ready to engage rapidly-moving markets. Still, it’s crucial to remember that with great opportunities come great risks. That’s where volatility indicators like Bollinger Bands, ATR, VIX, Keltner Channels, Donchian Channels, Chaikin Volatility Indicator, RVI, Standard Deviation, and CMO come in handy.
These nifty tools help traders get a better grip on market dynamics, spot trends, and manage risks effectively. They’re essential for making sound decisions and seizing fleeting opportunities in fast-paced market environments. So, if you’re planning to dive into the world of volatility trading, test out a few of these indicators and be vigilant about managing your risks. After all, navigating turbulent markets successfully is all about staying sharp and making the right moves at the right time.
Please be aware that the content of this blog is based upon the opinions and research of GFF Brokers and its staff and should not be treated as trade recommendations. There is a substantial risk of loss in trading futures, options and forex. Past performance is not necessarily indicative of future results.
Be advised that there are instances in which stop losses may not trigger. In cases where the market is illiquid–either no buyers or no sellers–or in cases of electronic disruptions, stop losses can fail. And although stop losses can be considered a risk management (loss management) strategy, their function can never be completely guaranteed.
Disclaimer Regarding Hypothetical Performance Results: HYPOTHETICAL PERFORMANCE RESULTS HAVE MANY INHERENT LIMITATIONS, SOME OF WHICH ARE DESCRIBED BELOW. NO REPRESENTATION IS BEING MADE THAT ANY ACCOUNT WILL OR IS LIKELY TO ACHIEVE PROFITS OR LOSSES SIMILAR TO THOSE SHOWN. IN FACT, THERE ARE FREQUENTLY SHARP DIFFERENCES BETWEEN HYPOTHETICAL PERFORMANCE RESULTS AND THE ACTUAL RESULTS SUBSEQUENTLY ACHIEVED BY ANY PARTICULAR TRADING PROGRAM.
ONE OF THE LIMITATIONS OF HYPOTHETICAL PERFORMANCE RESULTS IS THAT THEY ARE GENERALLY PREPARED WITH THE BENEFIT OF HINDSIGHT. IN ADDITION, HYPOTHETICAL TRADING DOES NOT INVOLVE FINANCIAL RISK, AND NO HYPOTHETICAL TRADING RECORD CAN COMPLETELY ACCOUNT FOR THE IMPACT OF FINANCIAL RISK IN ACTUAL TRADING. FOR EXAMPLE, THE ABILITY TO WITHSTAND LOSSES OR TO ADHERE TO A PARTICULAR TRADING PROGRAM IN SPITE OF TRADING LOSSES ARE MATERIAL POINTS WHICH CAN ALSO ADVERSELY AFFECT ACTUAL TRADING RESULTS. THERE ARE NUMEROUS OTHER FACTORS RELATED TO THE MARKETS IN GENERAL OR TO THE IMPLEMENTATION OF ANY SPECIFIC TRADING PROGRAM WHICH CANNOT BE FULLY ACCOUNTED FOR IN THE PREPARATION OF HYPOTHETICAL PERFORMANCE RESULTS AND ALL OF WHICH CAN ADVERSELY AFFECT ACTUAL TRADING RESULTS.