On May 12, as bitcoin and other cryptocurrencies were attempting to recover from their April pullback, Elon Musk sent out a tweet, reversing Tesla’s commitment to bitcoin as a form of payment.
Bitcoin took a sudden dive, from a high of $57,075 to a low of $46,395–almost a 19% drop in a matter of a few days.
That wasn’t the end of it. Soon afterwards, Chinese officials signaled they were cracking down on the use of cryptocurrencies, warning banks and businesses against accepting cryptos as a form of payment.
And then, the big crash happened.
From their May highs, the two most widely traded cryptocurrencies–Bitcoin and Ethereum–underwent a dramatic drop:
- Bitcoin plunged 47% in less than a week.
- Ethereum followed, cratering 61% well into June.
Other cryptos followed, as bitcoin and ethereum often lead the way as crypto’s two mega caps.
And then, something strange happened: Bitcoin bulls jumped in between the $30,000 and $28,400 range, while ethereum speculators began buying en masse at the $1,700 price level twice (May 23 and June 22).
Here’s what may seem puzzling: neither cryptos are widely adopted currencies–they have no real fundamentals to assess or price-in. In fact, China’s virtual “ban” should have discouraged crypto hopefuls from thinking that crypto adoption might soon happen.
So, why did traders and investors jump in at those specific levels? Why not sooner, or a higher price level? Why not wait until both crypto coins reach even lower levels (which is quite possible?
The Art of Betting on a Bullish Reversal
A similar thing happened in the broader US stock market following the Coronavirus Crash. Bear in mind, nobody knew how the pandemic would “pan out” in the near future, nor was anyone (even the Federal Reserve) able to forecast the damages it would have on the economy.
S&P 500 Index (SPX) – January 2019 – June 2020
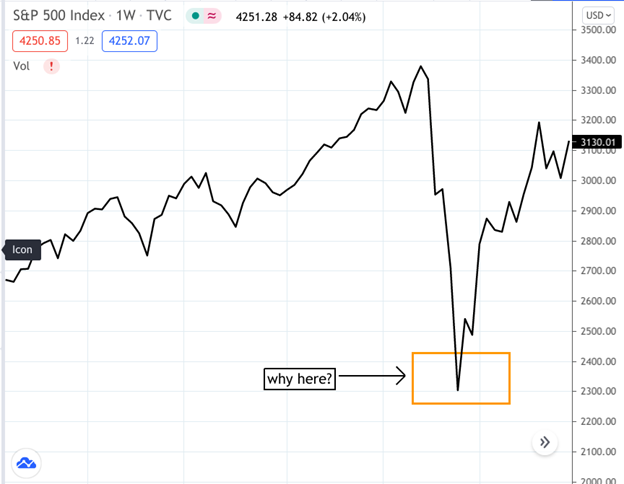
So, why did traders jump in around the 2300 range?
The answer is that it may have had little to do with price, given the lack of any reliable fundamental forecasts. It might have had everything to do with a very specific retracement measure: Fibonacci levels.
Fibonacci Levels May Provide Some Measure of Objectivity When No Reliable Economic Measure Exists
Your typical financial pundit will say something like, “If you want to buy XYZ, I’d wait for a pullback as its valuations are a bit high.” But a pullback to where? How far down must it go for it to be considered a healthy pullback?
Typically, analysts assess well-covered financial instruments with their own pricing models–hence the term “priced-in.” They take a stock or futures instrument, make calculations across several market and economic data fields, and come up with a price forecast.
But what if you can’t price-in anything either because there’s a lack of fundamental data, or too many variables, or, as in the case of bitcoin and ethereum, no fundamentals at all?
When there’s no objective fundamental measure, traders often rely on technicals to measure pullbacks and possible entry points–namely, Fibonacci levels.
We won’t get into the specifics of Fibonacci levels, but here’s a snapshot of how traders might view Fibs (as we call it) as it pertains to a pullback.
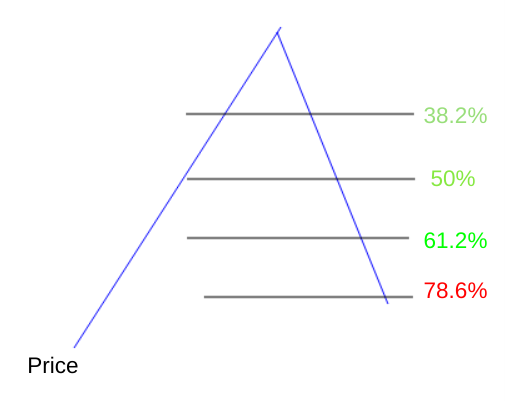
- A Fib retracement of only 38.2% is a weak pullback; possibly too soon to enter a long position (though some traders will enter at this level).
- A 50% retracement is a critical level, as both bulls and bears may be holding unrealized gains.
- Once an asset falls to 61.2%, then this is potentially one of the best entry points to take, assuming that the asset reverses.
- A fall to 78.6% signals danger–signaling that the uptrend may be reversing.
Jumping in Near the 61.2% Fibonacci Range
So what does this have to do with the unprecedented S&P 500 Corona Crash, or the bitcoin and ethereum plunges? See for yourself.
First, let’s look at S&P 500…
SPX Monthly April 2016 – June 2021
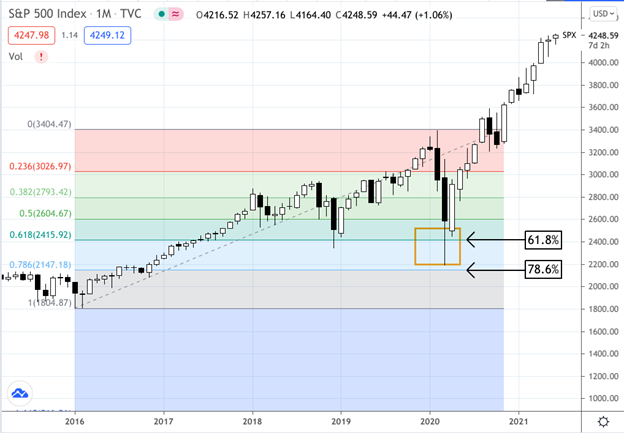
Comment: notice how buyers began entering positions at the 61.8% level, barely hitting the 78.6% “floor.”
Now, let’s take a look at the cryptos: bitcoin and then ethereum.
Bitcoin Futures (BTC) – Weekly – August 2020 to June 2021
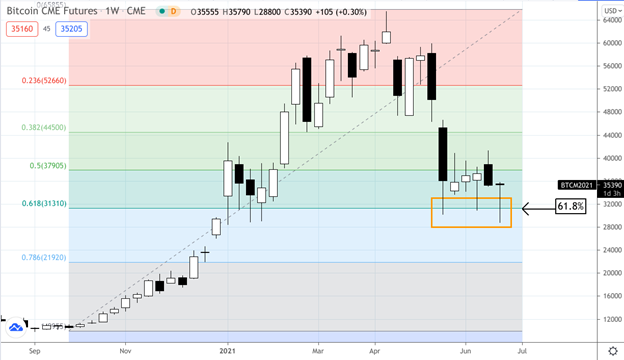
Comment: catching this entry point required a longer term view, on easier seen using a weekly chart.
Ethereum (ETHUSD) – January 2020 – June 2021
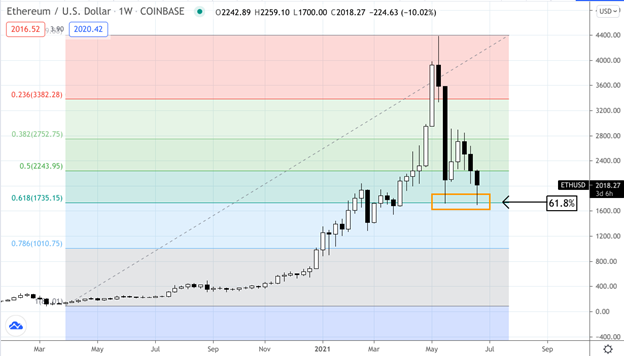
Comment: this is similar to BTC, but given the difference in prices, and the fact that these are two separate cryptocurrencies, note the precision of the entrances at the 61.8% Fibonacci level.
The Bottom Line
Fibonacci retracements are by no means a be-all end-all solution. In most cases, you’ll want to check various fundamental and economic data to determine a strong entry point. But when there isn’t enough available information–a situation in which you have very little to go by–then Fibonacci levels, as a tactical entry tool, is one of the best measures you can use.
Please be aware that the content of this blog is based upon the opinions and research of GFF Brokers and its staff and should not be treated as trade recommendations. There is a substantial risk of loss in trading futures, options and forex. Past performance is not necessarily indicative of future results.