There are many metrics you can use to evaluate a trading system’s performance. Too many, perhaps. You may be wondering how an automated system’s drawdowns weigh-in against its annual ROI, or whether the MAR ratio might provide a clearer picture than its Sharpe, Sortino, or Sterling ratio. Perhaps the equity curve is your best performance gauge–after all, many futures trading system subscribers choose their system based on it’s equity curve.
The aforementioned metrics each provide their own unique angle of interpretation, but perhaps the last one–equity curve–may be the worst metric to use, as it appeals to sentiment and immediacy rather than objectivity and lengthy observation.
Using Equity Curve as a Metric Can Hurt Your Account
Let’s suppose you find a system that has performed well over the last few months. You jump in and subscribe to it, only to see your account equity sink along with the system’s performance.
So you find another system that appears to be outperforming the others, and you subscribe to that one, dumping your first system. Next thing you realize, even that system is starting to underperform. Then you decide to give system trading another go and test out a 3rd system, but then it goes into the red shortly thereafter.
Now, let’s suppose you gave up entirely. What if (and a big IF), six months later all three systems generated positive returns? There’s a possibility that you just caught all three systems at the onset of their drawdowns. Remember, systems go up and down, and if you jump into a system that’s performing well, it’s just a matter of time before it declines, however long that may take.
Hence, equity curve provides very little information for an accurate assessment. It appeals to “recency bias,” which in turn can prevent you from giving a system enough time to prove its worth or worthlessness.
Two Metrics That Might Help You Better Assess System Performance
In an interview with well-renowned technical John Ehler (Technical Analysis for Stocks & Commodities, September 2019 issue – Karl Montevirgen interviews John Ehler), Ehler mentions two of his most trusted metrics: Profit Factor and Winning Sessions.
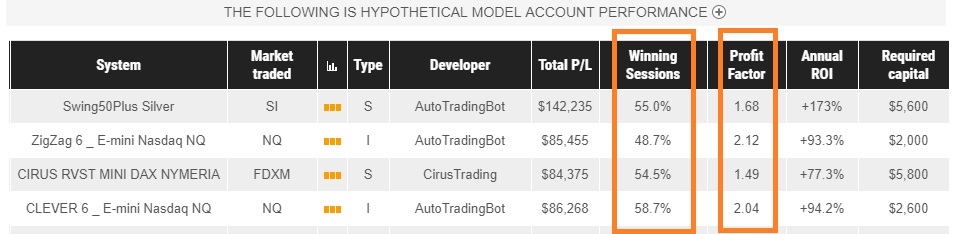
You can view “Winning Sessions” and “Profit Factor” on GFF Broker’s Automated Trading page in the 8th and 9th column (screenshot shown below with orange boxes highlighting these sections). As you review this data, please be aware that these statistics are calculated via the combination of three hypothetical data sets: (1) Backtested, (2) Tracked, and where available (3) Live. Please review the full disclaimer at the end of this article for details.
Profit Factor – ratio of positive returns over negative returns. The figure is derived by dividing the average win by the average loss)
- Positive example: if your trading system generates an average positive return of, say, $100, and an average loss of $50, then your profit factor is 2 (or 2-to-1, in ratio form 2:1). You can get this figure by dividing 100 by 50. This means that the system generates an average of two winning units over each unit of loss.
- Negative Example: if the system returns an average positive return of $90 and an average negative return of -$100, then your profit factor 0.9, or 0.9 return for every 1.00 loss–not a very good return as the system had produced more negative than positive returns.
Winning Sessions – frequency of winning trades (shown as a percentage). If the system generates 5 “wins” out of 10 trades, then the other 5 trades are likely losing trades. It has a 50% “win rate” and conversely, a 50% loss rate.
Remember: neither of these metrics are predictors, but data-based evaluations of past performance (and past performance doesn’t necessarily indicate future results).
Combining Profit Factor with Winning Sessions to Assess Performance
But what if the profit factor is high but the system has a low number of winning sessions. Or what if the system has a number of winning trades but a low profit factor? How might you balance both to see when one might negatively affect the other?
Here’s one way to figure this out:
(Win session % x Profit Factor) – (Lose session % x 1)
- Calculation is greater than zero is positive performance
- Calculation is less than zero is negative performance
So let’s imagine a system that has an extremely high profit factor of 4.5-to-1. What if it has a low percentage of winning sessions, say 20% (meaning it loses 80% of the time). If you couldn’t see its equity performance, can you tell if the system might it still be profitable?
Plug in the numbers and you get: (0.20 x 4.5) – (0.80 x 1) = 0.1 which is greater than zero. The system barely made it into the positive, but it nevertheless generated positive returns. Keep in mind that had the profit factor been even slightly lower, this system would show negative performance based on this calculation.
There Are Many Other Ways to Evaluate Trading Performance
There’s a plethora of performance metrics out there. As you get more accustomed to analyzing performance, you may learn about the informational nuances that each can provide. But generally, profit factor and winning sessions can already tell you a lot. It’s certainly better to use these two than just relying on equity curve without further analysis.
Please be aware that the content of this blog is based upon the opinions and research of GFF Brokers and its staff and should not be treated as trade recommendations. There is a substantial risk of loss in trading futures, options and forex. Past performance is not necessarily indicative of future results.
Explanation on the Calculation for Hypothetical Performance displayed at: https://www.gffbrokers.com/technology/automated-trading/
The statistics on this page are calculated via the combination of three hypothetical data sets: Backtested, Tracked, and where available Live.
Backtested performance is calculated by running a trading system backwards in time, and seeing what trades would have been done in the past when applied to backadjusted data. Tracked performance is calculated by running the trading system forwards on data each and every day, and logging the trades as they happen in real time day after day. Live performance is calculated by running the trading system on live tick data for actual clients and tracking the actual buy and sell prices those clients trading the system receive in their account.
We use Live results to calculate monthly returns for any month in which clients were trading for the entire month, Tracked fills for those months in which there are no client fills for the entire month, and computer generated fills for those months occurring before we loaded the system onto our trade servers. The results are hypothetical in that they represent returns in a model account. The model account rises or falls by the single contract profit and loss achieved by the system in whichever data set is available. The hypothetical model account begins with the Suggested Capital listed, and is reset to that amount each month. The percentage returns reflect inclusion of commissions, fees, slippage, and the cost of the system. The commission, slippage, fees, and monthly system costs are subtracted from the net profit/loss prior to calculating the percentage return.
Please note that the method of resetting the model account to the initial value at the start of each month creates a track record which is representative of the simple returns for each time period, but that it does not, by definition, show how returns would compound over time. Should an investor following said program trade a single contract indefinitely without also resetting their account to the initial capital amount each month, their performance will differ from the performance detailed herein.
Disclaimer Regarding Hypothetical Performance Results:
HYPOTHETICAL PERFORMANCE RESULTS HAVE MANY INHERENT LIMITATIONS, SOME OF WHICH ARE DESCRIBED BELOW. NO REPRESENTATION IS BEING MADE THAT ANY ACCOUNT WILL OR IS LIKELY TO ACHIEVE PROFITS OR LOSSES SIMILAR TO THOSE SHOWN. IN FACT, THERE ARE FREQUENTLY SHARP DIFFERENCES BETWEEN HYPOTHETICAL PERFORMANCE RESULTS AND THE ACTUAL RESULTS SUBSEQUENTLY ACHIEVED BY ANY PARTICULAR TRADING PROGRAM.
ONE OF THE LIMITATIONS OF HYPOTHETICAL PERFORMANCE RESULTS IS THAT THEY ARE GENERALLY PREPARED WITH THE BENEFIT OF HINDSIGHT. IN ADDITION, HYPOTHETICAL TRADING DOES NOT INVOLVE FINANCIAL RISK, AND NO HYPOTHETICAL TRADING RECORD CAN COMPLETELY ACCOUNT FOR THE IMPACT OF FINANCIAL RISK IN ACTUAL TRADING. FOR EXAMPLE, THE ABILITY TO WITHSTAND LOSSES OR TO ADHERE TO A PARTICULAR TRADING PROGRAM IN SPITE OF TRADING LOSSES ARE MATERIAL POINTS WHICH CAN ALSO ADVERSELY AFFECT ACTUAL TRADING RESULTS. THERE ARE NUMEROUS OTHER FACTORS RELATED TO THE MARKETS IN GENERAL OR TO THE IMPLEMENTATION OF ANY SPECIFIC TRADING PROGRAM WHICH CANNOT BE FULLY ACCOUNTED FOR IN THE PREPARATION OF HYPOTHETICAL PERFORMANCE RESULTS AND ALL OF WHICH CAN ADVERSELY AFFECT ACTUAL TRADING RESULTS.