The Problem with Timing Market Tops and Bottoms
If there is one thing that traders are exceptionally bad at doing…one thing that tends to produce losses on a consistent basis…it’s the attempt to fade market tops and bottoms.
Like any form of speculation, nobody can be certain of a future outcome. Nobody can “predict” what’s going to happen next. And speculating on market tops and bottoms has another, perhaps additional, element of risk: you are trading against the current trend.
Many traders simply avoid this kind of attempt, and for good reason: why take the risk when you can wait for the trend to reverse, if it does so at all?
Some traders, however, want to take a more aggressive approach in exploiting a possible trend reversal; an opportunity to get in early on a reverse trend or short-term correction.
Q: Is there a setup that allows you to speculate on trend reversals in a manner that is measurable and that provides strict entry and stop loss points?
A: Yes, there are a few. And what we’re about to present is just one of them: exhaustion gaps.
Identifying Exhaustion Gaps
Before we get started, let’s go over a few basics. There are two concepts that go into the term exhaustion gap:
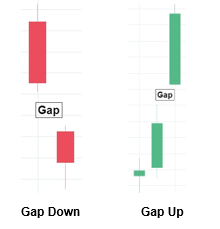
- An exhaustion gap is a form of “trading gap.” A trading gap typically occurs when price opens well above or below the last close, enough to create a “gap” between both prices.
- An exhaustion gap occurs after a lengthy or steep trend, whether up or down. What is tricky about this is that you can never be 100% certain whether a trend is about to end, no matter how long the trend had sustained itself or how steep its slope may be. This is a speculative endeavor.
How to Trade Exhaustion Gaps
Because exhaustion gaps can’t be identified with absolute certainty, trading them requires strict rules for entry and exit.
Using an objective setup means that you can at least place a stop loss at the price beyond which your bias (up or down) will no longer be valid.
Here are the suggested rules:
- Identify a market that has been on a steep uptrend or downtrend (the steeper the better).
- Locate the price gap in the direction of the trend.
- Identify the highest point (uptrend resistance) or lowest point (downtrend support) so that you can determine where to place your stop loss.
- In an uptrend:
- Be ready to place a market stop to go short a few ticks below the low of the bar that had gapped up.
- If the market keeps moving up, it has to show a weakening of momentum (otherwise, the uptrend is still intact).
- In a downtrend:
- Be ready to place a market stop to go long a few ticks above the high of the bar that had gapped down.
- If the market keeps moving down, it has to show a weakening of momentum (otherwise, the downtrend is still intact).
- In an uptrend:
- Once you’ve placed your entry point, place a stop loss a few ticks above the highest point (uptrend) or a few ticks below the lowest point (downtrend).
Example (uptrend):
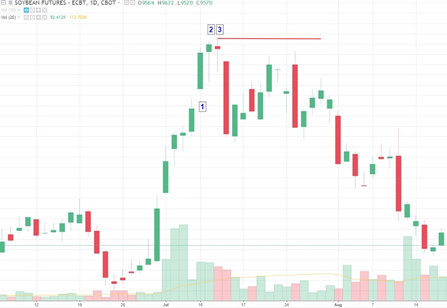
Soybeans Daily Chart June 6, 2017 to August 17, 2017
In this example, Soybean prices surged almost vertically across a 6-day trading session. The “uptrend” wasn’t lengthy, but the sharp rise in price was unusually steep. What gave us an indication that price might be reversing is the gap at (1). Because this gap was noticed at the high of a steep price move, we could anticipate that this might be indicative of an exhaustion gap.
Since the bar following the gap at (1) was exceedingly bullish (price moved straight up), we were looking for a bar that indicated a weakening of momentum.
We found that at (2) in which you can see buyers pushing up price from its lows (notice the long tail) but unable to push the price far above the preceding bar. We would have placed our entry point to go short a few ticks below the low of (2).
The following day (3), the trading session was similar to the previous day but with a few big differences: first, buying pressure kept price away from its lows; second, price exceeded the previous day’s highs; but the session ended up closing lower than its open.
This last session at (3) was enough of a sign that price momentum had weakened. A good entry point would be a few ticks below the lows of (2) while the stop loss would have been a few ticks above the high of (3).
As you can see, price became volatile immediately afterwards, consolidating but eventually moving toward the downside.
Downtrend scenario would be the reverse (see the suggested rules above). Exhaustion gaps are not very common as they usually take place at the end of long trends (which takes time to form) or at the end of price shocks (which don’t happen often).
So, when you do identify what looks suspiciously like an exhaustion gap, it may present a somewhat rare trading opportunity.
And if you decide to take that opportunity, be sure you have clear entry and exit points, and an objective set of rules to follow because your trading thesis might be wrong.
Please be aware that the content of this blog is based upon the opinions and research of GFF Brokers and its staff and should not be treated as trade recommendations. There is a substantial risk of loss in trading futures, options and forex. Past performance is not necessarily indicative of future results.