This year has been a wild one for the crude oil market. On January 8, 2020, crude oil futures reached a high of $65.65 a barrel. By March 30, the price of crude settled was down near $20 a barrel. It was a steep -69% drop in less than months.
The plunge was largely related to the Covid-19 outbreak, but there were other complicating factors. Most of the developed world by then had begun shutting down. But a major driver of this decline was the price war between Russia and Saudi Arabia.
Background on OPEC+
Crude Oil – Daily – May 2013 to February 2017 (Chart created using TradingView)
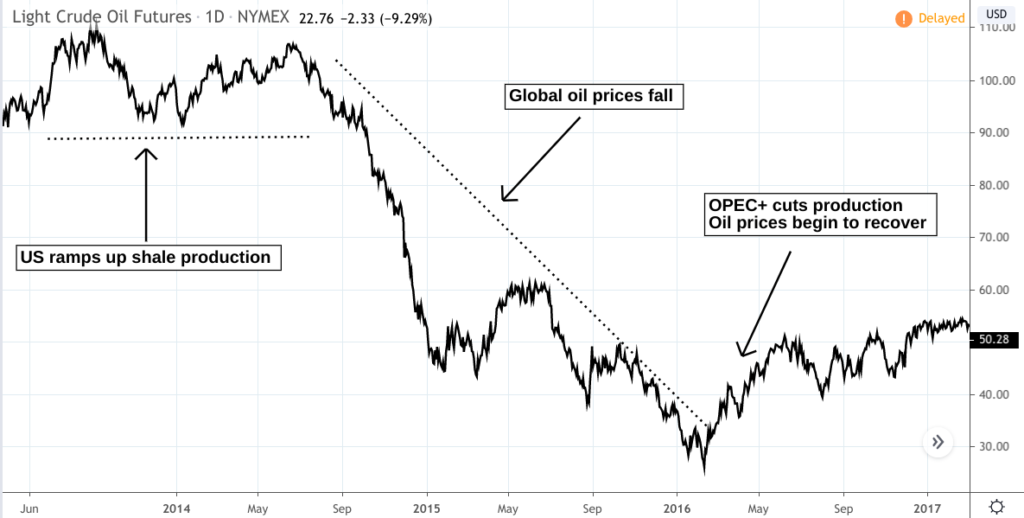
In 2014, the United States increased its shale oil production, making it the top oil-producing nation in the world. America’s output crashed global oil prices, crude oil falling from $114 a barrel in 2014 to $27 in 2016.
In response to this drop, Russia and a handful of small non-OPEC producers agreed to cooperate with Saudi Arabia and its OPEC alliance, an arrangement dubbed “OPEC+”. The agreement was to manage the price of oil by cutting production.
By January 2020, OPEC+ had cut production by 2.1 million barrels per day, with Saudi Arabia taking the largest share of cuts.
The Russia/Saudi Price War
Crude Oil – Daily – January 1 to April 7, 2020 (Chart created using TradingView)
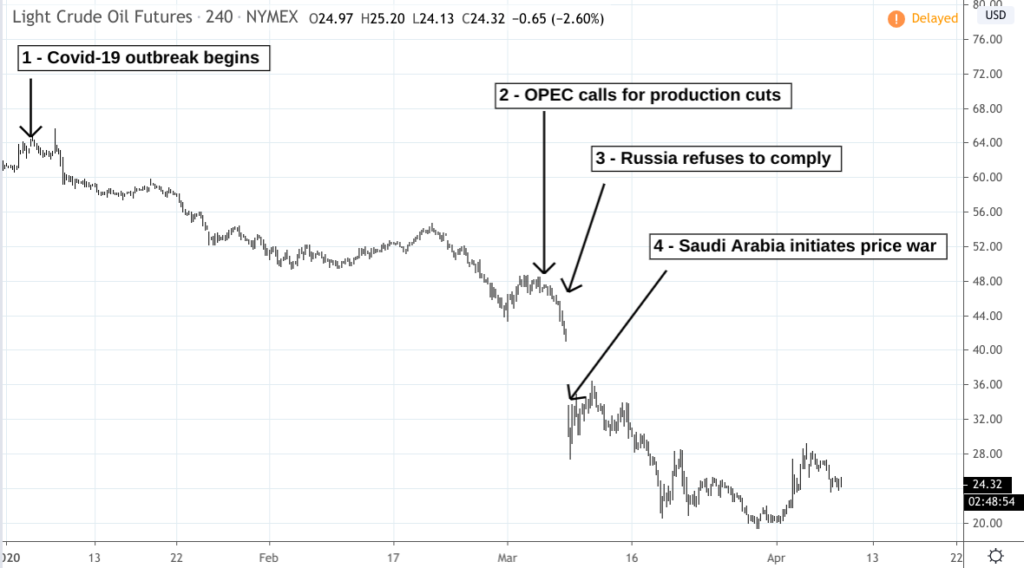
As the coronavirus pandemic took hold in 2019-2020, factory output and transportation demand fell, significantly decreasing oil demand. OPEC projected that oil demand would fall to as low as 825,000 barrels per day.
[2] On March 5, OPEC decided to cut oil production by an additional 1.5 million barrels per day, asking all other OPEC+ nations to abide by the decision.
[3] The following day, Russia rejected the OPEC request, causing oil prices to fall by an additional 10% after the announcement.
[4] Saudi Arabia began a price war with Russia on March 8. Oil prices then fell another 34%, crude oil hitting a low of $19.27 on March 30.
So, What’s the Big Deal with Low Oil Prices?
Cheaper oil and gas is always favorable to consumers. But it’s problematic for US oil producers, particularly those in the shale industry, as many of them are operating with high levels of debt.
Low prices means reduced profit margins. If the current price range sustains itself over time, it can crash the US shale industry. Many of the smaller producers overloaded with debt may default on their loans.
Fortunately, it appears that Russia and Saudi Arabia had reached a resolution as of April 9, 2020, thus ending the recent price war.
How Do You Trade Such an Event?
When major events like these take place–movements that are fundamentally-driven–technical levels may or may not be reliable as the market may reprice support and resistance levels and oversold/overbought ranges.
Perhaps a wise trade to have taken would have been to purchase put options on Crude Oil (CL) futures back in January when COVID-19 began shutting down Chinese cities and factories (indicating a slowing in demand). You might also have placed a protective “long” stop order at 66.00 in case your put strategy didn’t work out.
Considering that price is currently near 2002 lows, a long position on crude might prove favorable, but not until COVID-19 lockdowns are fully lifted. This means you may have to wait for some time for this trade to yield results. You also have to risk the possibility that crude prices may go even lower depending on economic factors that are volatile and highly uncertain.
If anything, the current situation in oil may favor the longer-term position trader. But you’d have to have adequate capital to maintain a position. You’d also need enough capital resources to sustain potential losses. Perhaps buying calls would reduce your downside risk (as your risk would be limited to option premiums and fees). But what nobody knows is how long COVID-19 will keep its hold on the economy, making it difficult for any trader to determine a reasonable strike price and expiration date.
Please be aware that the content of this blog is based upon the opinions and research of GFF Brokers and its staff and should not be treated as trade recommendations. There is a substantial risk of loss in trading futures, options and forex. Past performance is not necessarily indicative of future results.
Be advised that there are instances in which stop losses may not trigger. In cases where the market is illiquid–either no buyers or no sellers–or in cases of electronic disruptions, stop losses can fail. And although stop losses can be considered a risk management (loss management) strategy, their function can never be completely guaranteed.
Disclaimer Regarding Hypothetical Performance Results: HYPOTHETICAL PERFORMANCE RESULTS HAVE MANY INHERENT LIMITATIONS, SOME OF WHICH ARE DESCRIBED BELOW. NO REPRESENTATION IS BEING MADE THAT ANY ACCOUNT WILL OR IS LIKELY TO ACHIEVE PROFITS OR LOSSES SIMILAR TO THOSE SHOWN. IN FACT, THERE ARE FREQUENTLY SHARP DIFFERENCES BETWEEN HYPOTHETICAL PERFORMANCE RESULTS AND THE ACTUAL RESULTS SUBSEQUENTLY ACHIEVED BY ANY PARTICULAR TRADING PROGRAM.
ONE OF THE LIMITATIONS OF HYPOTHETICAL PERFORMANCE RESULTS IS THAT THEY ARE GENERALLY PREPARED WITH THE BENEFIT OF HINDSIGHT. IN ADDITION, HYPOTHETICAL TRADING DOES NOT INVOLVE FINANCIAL RISK, AND NO HYPOTHETICAL TRADING RECORD CAN COMPLETELY ACCOUNT FOR THE IMPACT OF FINANCIAL RISK IN ACTUAL TRADING. FOR EXAMPLE, THE ABILITY TO WITHSTAND LOSSES OR TO ADHERE TO A PARTICULAR TRADING PROGRAM IN SPITE OF TRADING LOSSES ARE MATERIAL POINTS WHICH CAN ALSO ADVERSELY AFFECT ACTUAL TRADING RESULTS. THERE ARE NUMEROUS OTHER FACTORS RELATED TO THE MARKETS IN GENERAL OR TO THE IMPLEMENTATION OF ANY SPECIFIC TRADING PROGRAM WHICH CANNOT BE FULLY ACCOUNTED FOR IN THE PREPARATION OF HYPOTHETICAL PERFORMANCE RESULTS AND ALL OF WHICH CAN ADVERSELY AFFECT ACTUAL TRADING RESULTS.