The price of all three major U.S. indices are showing increasingly weaker momentum when viewed from their 200-day moving average price.
As you may know, moving averages were designed to gauge the strength of price trends over time. Exponential moving averages (EMA) show price weighted to reflect more recent price movement. In gauging trends, longer time periods reflect longer-term trends. We are looking at the 200-day exponential moving average to assess how price is “bouncing off” this longer-term price range.
A common assumption among traders is that in a strong uptrend, a market experiencing a “correction” might dip into a longer-term moving average price range (in our case, the 200-day EMA constitutes a long-term correction level).
If an uptrend were supported by strong fundamentals and positive forward guidance, the lower price range should attract a large number of buyers, generating enough buying volume to push the market price back up, continuing its uptrend.
This is not what we are currently seeing in the DJIA, S&P 500, and NASDAQ 100 indices:
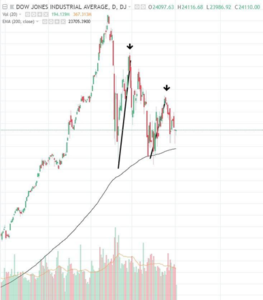
DJIA: Daily chart exhibiting weaker bounces off 200-Day EMA (Sep 2017 – May 1)
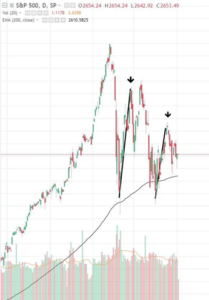
S&P 500: A chart of a larger index representing a larger share of the U.S. stock market is also exhibiting a decline in upward momentum (Sep 2017 – May 1)
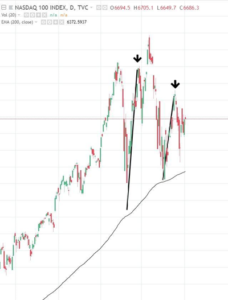
NASDAQ 100: A strong representation of the U.S. tech sector showing slightly more resilience yet its latest bounce indicates a weakening.(Sep 2017 – May 1)
Should fundamental conditions cause this uptrend to break, how far down could these indices go?
At this point, using moving averages on the “weekly” scale would be a purely technical forecast that may be disconnected from the rapidly shifting economic realities that are yet to unfold.
But for the sake of hypothetical speculation, let’s take a look at the DJIA weekly chart, plotting a 200 EMA as yet an even longer-term trend and potential area of support:
DJIA Weekly chart (Feb 2016 – May 1)
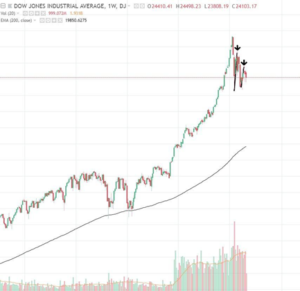
If we were to assume that the DJIA price would correct to the 200 EMA range, then what we are looking at is a major bear market, one that would potentially wipe out a significant amount of its 2017 gains.
This scenario also applies to the S&P 500 and the NASDAQ 100.
For investors, this would not be a good scenario. For active traders, such a scenario may be accompanied by greater volatility, which as we know, brings increased risk as well as increased opportunity.