As COVID-19 wreaks havoc across every aspect of human existence, the global economy appears to be careening toward total chaos.
And although the global economy seems to be slowing to a halt, the possibility remains that COVID-19’s economic ramifications haven’t yet completely taken hold. Arguably, there’s plenty more to come.
Amid all of the uncertainties, one thing that is certain is that the economic fallout can’t be fully measured let alone controlled until the pandemic itself is resolved.
As a trader or investor, you’re probably wondering how to invest in such an environment. And that’s what we’re going to explore in this article.
Two Things: Stock Market Risk and ‘Safety’
During a period of prolonged crisis–say a bear market or recession–traders typically do one of two things: stay in the markets (whether long or short), or seek safety in bonds, gold, or cash.
For the purpose of this blog, we will focus on the long scenarios only, as we want to highlight what happens with the above futures instruments during a period of prolonged economic crisis.
Have All Commodities Performed Well During Economic Crises?
The truth is that not all commodity classes–agriculture, currencies, energies, financials, metals, and indices–have performed well during specific economic downturns. Commodity bulls and bears are like rotating sectors–there’s no reliable cycle to guarantee which commodity might outperform another.
Which Commodities Might Have Performed Well Under Crisis Scenarios?
For our purposes, let’s think practically and limit our focus to alternative investments that are responsive to what most of us are really concerned about–namely, the stock market, recession, and inflation.
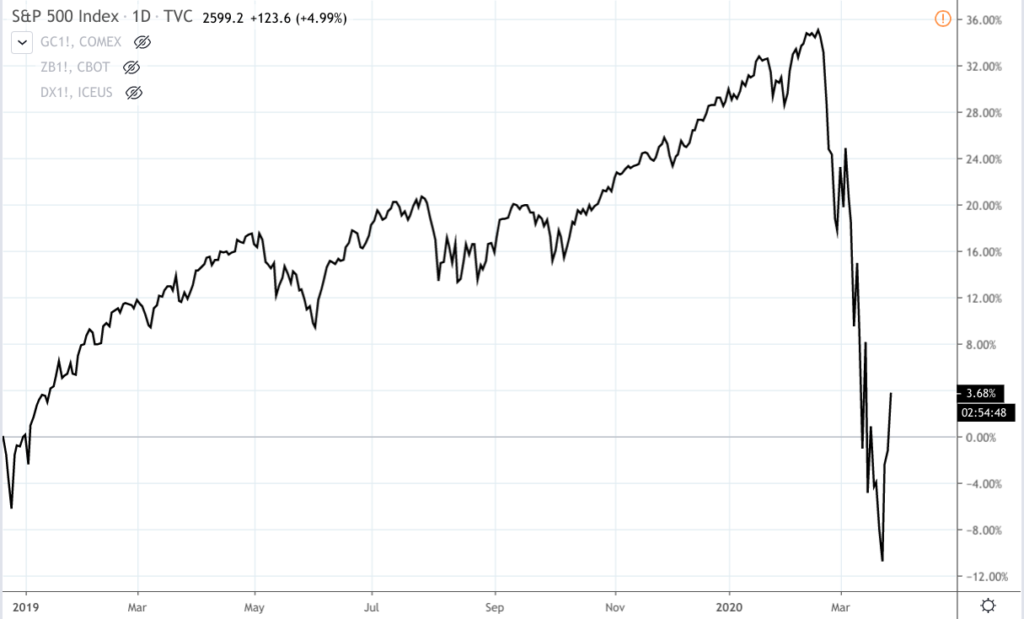
We know that the S&P 500 has recently tanked from an all-time closing high of around 3386.00, nearly wiping out all of its gains from 2019, 2018, and even 2017. Here’s a chart that shows the SPX from the end of December 2018.
S&P 500 Index – Daily – December 2018 to March 2020 (Chart created using TradingView)
So, what commodity investments might have played a role in hedging such a dismal turn? Typically, U.S. investors would turn to bonds (some would consider gold).
If the magnitude of the crash is significant enough, which in this case it is, global investors would exchange their local currencies for the U.S. dollar.
Anticipating the negative impact that the Fed’s QE stimulus might have on the dollar’s purchasing power, some investors might seek safety in gold.
So, we have four instruments:
- Stock Index (SPX or ES as a proxy)
- Bonds (30-Year TBonds or ZB)
- Cash (or the U.S. dollar index, DX)
- Gold (GC).
Let’s take a look at how these instruments performed in the most recent crash.
S&P 500, ZB, DX, and GC – Daily – December 2018 to March 2020 (Chart created using TradingView)
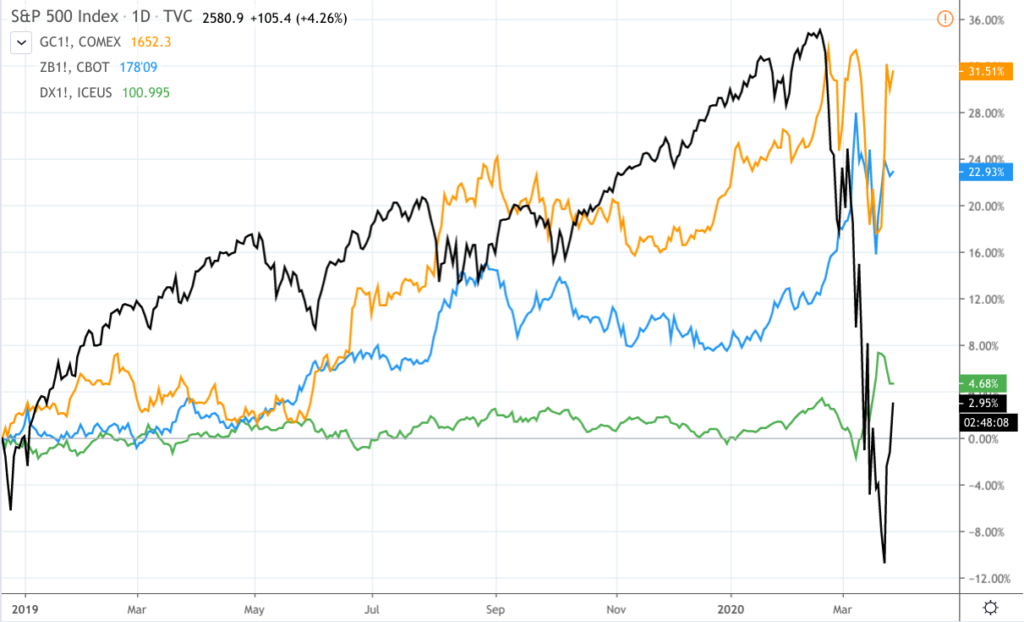
As you can see, these three instruments (ZB, DXI, and GC) helped hedge the S&P 500 (SPX, or ES, if you’re holding futures).
So, how might this mix have performed under past economic crises?
The Great Recession of 2008
S&P 500, ZB, DX, and GC – Daily – October 2007 to March 2009 (Chart created using TradingView)
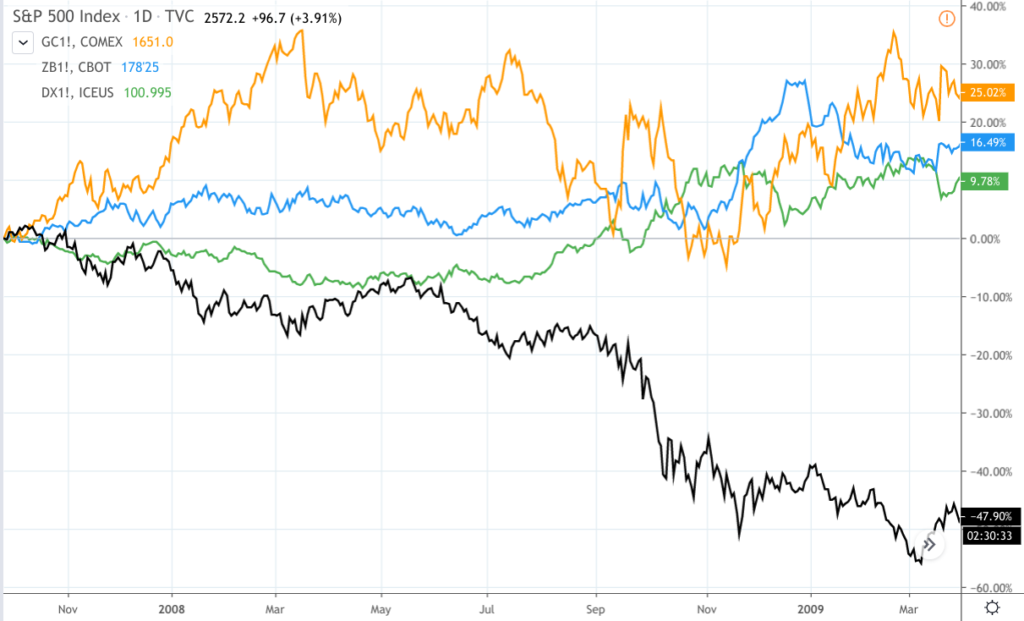
Remember the Great Recession? The S&P 500 sunk -57% before turning around and entering the current bull market (the longest bull in U.S. history).
While holding cash, or the dollar index, might have helped hedge the S&P 500 index, bonds remained steady. Note that bond prices often increase sharply when investors begin panic-selling their stocks.
Gold remained volatile yet within its top range. Ultimately, all three instruments outperformed the broader stock market. And holding these instruments via futures while maintaining a stock position might have served as an effective hedge throughout the two years of market turmoil.
The Tech Bubble of 2000
S&P 500, ZB, DX, and GC – Daily – April 1999 to October 2002 (Chart created using TradingView)
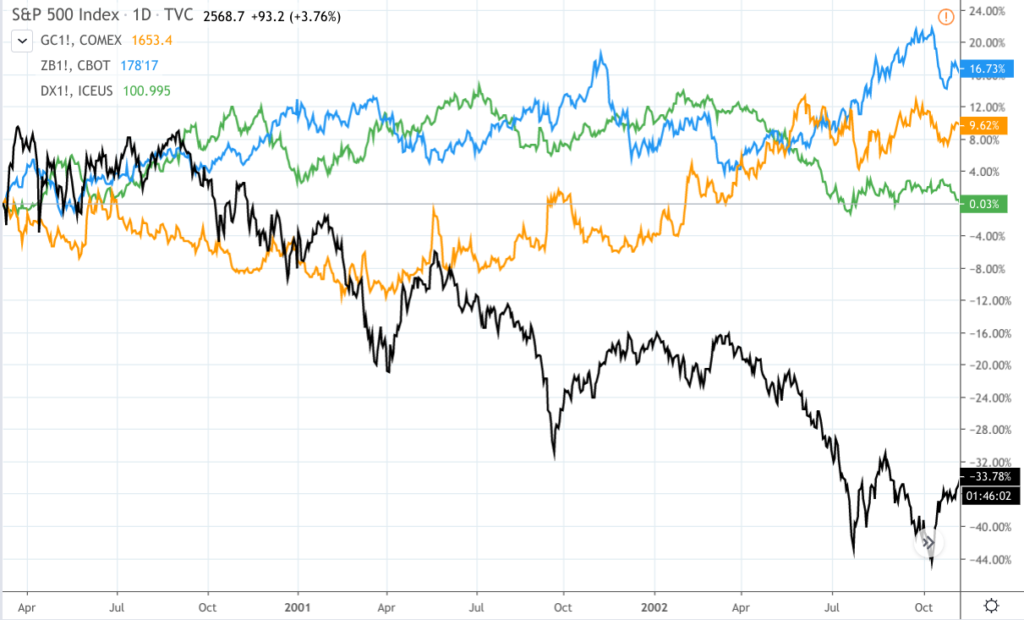
The tech bubble crash of 2000 was the second longest downturn in U.S. history. Lasting 30 months, it brought the S&P 500 down -49%. Meanwhile, gold began surging at the start of 2001, 30-year bonds rose (once again) as panic selling intensified, while cash remained steady.
The Crash of 1987
S&P 500, DX, and GC – Daily – January 1987 to November 1987 (Chart created using TradingView)
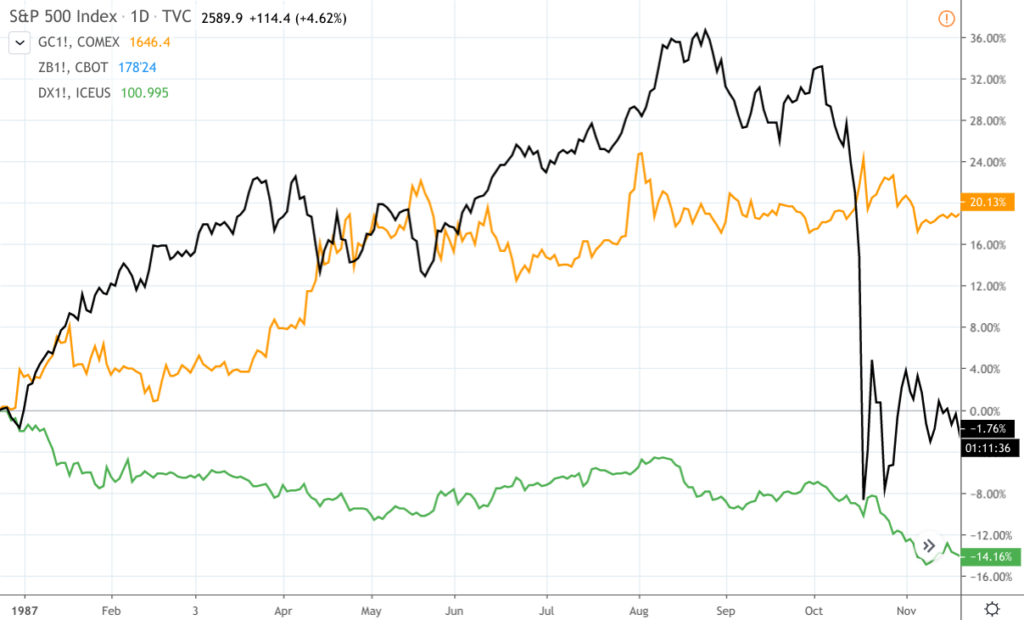
30-year TBond data (ZB) is not on the chart, but bonds rose 1.06%, 1.16%, and 2.25% in the three weeks starting October 18, 1987, according to investing.com. As you can see, the value of the dollar declined along with stocks, while gold continued its steady rise, hovering within the 20% to 24% range.
Performance Over the Decades
For position traders, market entries and position weighting (i.e. how much of any single assets you hold) can make a big difference.
If you were heavy stock indices (ES, YM, or NQ), you might have benefitted from the longest stock bull market in U.S. history, as shown in the S&P 500 chart below.
S&P 500, ZB, DX, and GC – Monthly – 2010 to 2020 (Chart created using TradingView)
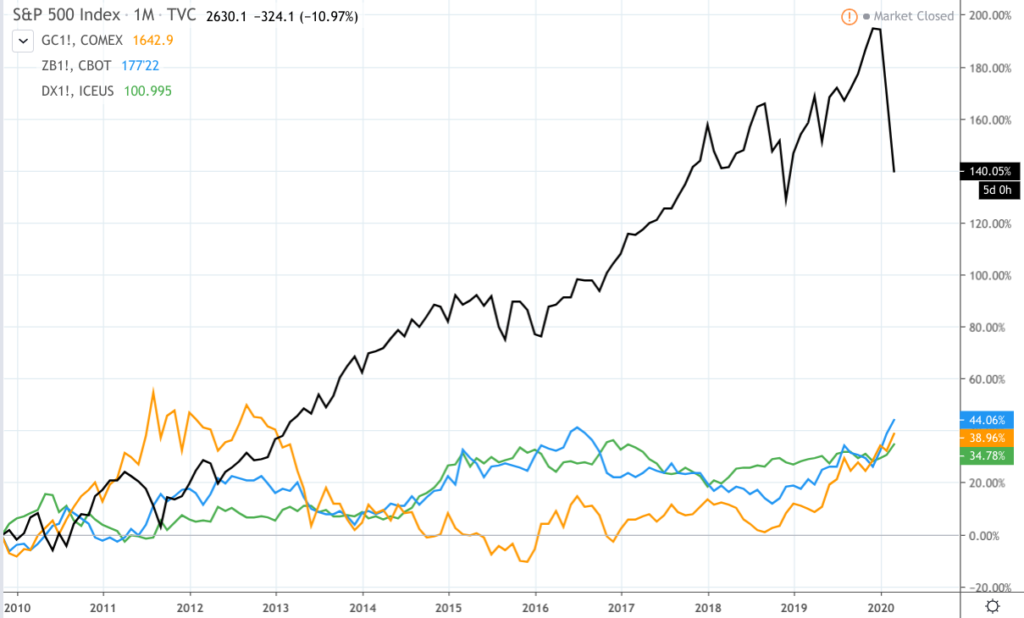
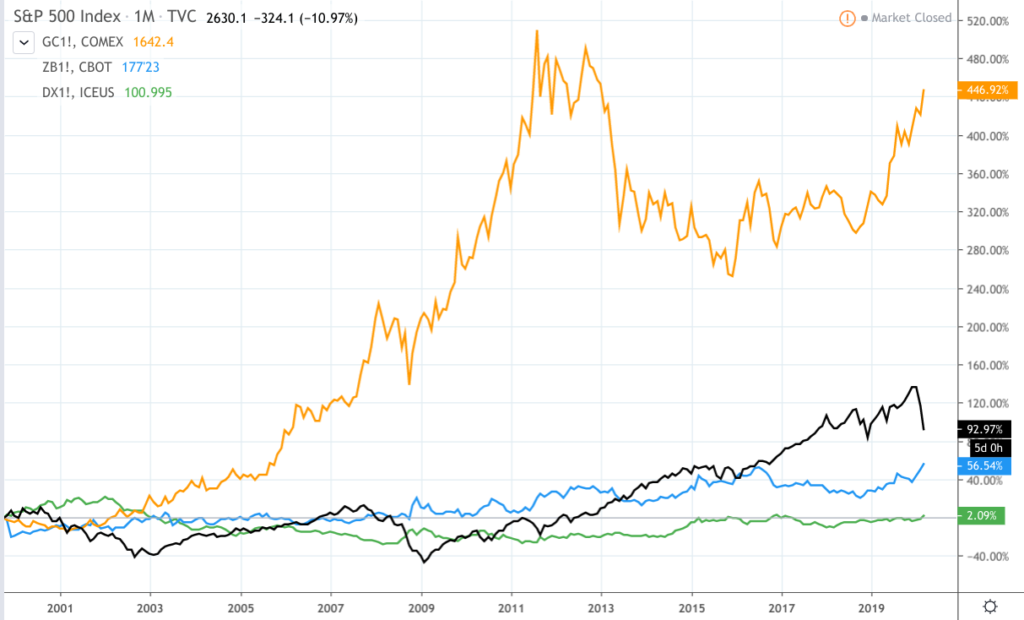
But if you had held these same assets since 2000, two decades prior, your returns might have looked slightly different, with gold taking the lead.
S&P 500, ZB, DX, and GC – Monthly – 2000 to 2020 (Chart created using TradingView)
The Bottom Line
Economic crises are always frightening to navigate. Many mainstream investors choose to exit the markets rather than hold steady through the storm. Position traders knowledgeable in commodities might see things differently (depending on their area of focus).
Although the fundamental conditions driving a crisis are often too complex for most non-professionals to analyze, let alone forecast, solutions to weathering a storm can be simpler than you might think. Your best bet to weather the storm is to try to choose the right assets and hold the right allocations.
Please be aware that the content of this blog is based upon the opinions and research of GFF Brokers and its staff and should not be treated as trade recommendations. There is a substantial risk of loss in trading futures, options and forex. Past performance is not necessarily indicative of future results.
Disclaimer Regarding Hypothetical Performance Results: HYPOTHETICAL PERFORMANCE RESULTS HAVE MANY INHERENT LIMITATIONS, SOME OF WHICH ARE DESCRIBED BELOW. NO REPRESENTATION IS BEING MADE THAT ANY ACCOUNT WILL OR IS LIKELY TO ACHIEVE PROFITS OR LOSSES SIMILAR TO THOSE SHOWN. IN FACT, THERE ARE FREQUENTLY SHARP DIFFERENCES BETWEEN HYPOTHETICAL PERFORMANCE RESULTS AND THE ACTUAL RESULTS SUBSEQUENTLY ACHIEVED BY ANY PARTICULAR TRADING PROGRAM.
ONE OF THE LIMITATIONS OF HYPOTHETICAL PERFORMANCE RESULTS IS THAT THEY ARE GENERALLY PREPARED WITH THE BENEFIT OF HINDSIGHT. IN ADDITION, HYPOTHETICAL TRADING DOES NOT INVOLVE FINANCIAL RISK, AND NO HYPOTHETICAL TRADING RECORD CAN COMPLETELY ACCOUNT FOR THE IMPACT OF FINANCIAL RISK IN ACTUAL TRADING. FOR EXAMPLE, THE ABILITY TO WITHSTAND LOSSES OR TO ADHERE TO A PARTICULAR TRADING PROGRAM IN SPITE OF TRADING LOSSES ARE MATERIAL POINTS WHICH CAN ALSO ADVERSELY AFFECT ACTUAL TRADING RESULTS. THERE ARE NUMEROUS OTHER FACTORS RELATED TO THE MARKETS IN GENERAL OR TO THE IMPLEMENTATION OF ANY SPECIFIC TRADING PROGRAM WHICH CANNOT BE FULLY ACCOUNTED FOR IN THE PREPARATION OF HYPOTHETICAL PERFORMANCE RESULTS AND ALL OF WHICH CAN ADVERSELY AFFECT ACTUAL TRADING RESULTS.