Trading a volatile and non-trending market is a dangerous proposition.
There’s no trend. No evident direction. No apparent patterns or formations other than “noise” between two ranges of support and resistance.
Although trading itself comes with considerable risk, trading a market that gives no clear sign of direction can be exceedingly tricky. For instance, there’s no way of telling if an extreme move either up or down signals the end of a range and the beginning of a new trend.
If trading a volatile sideways can be risky, then so too can any “tactic” designed to trade such a market.
This is what we are going to present you in this article. This opening serves as a caveat, one disclosing the risks of such an endeavor. But if you are interested in a method by which you might be able to trade a ranging market, something you can add to your list of other techniques, then here it is.
Using Bollinger Bands to Gauge Extreme Price Movements
Bollinger Bands, developed by the technical trader, John Bollinger, were developed to gauge the volatility of an asset’s price movements. You have a standard moving average to represent the mean and two outer bands set at 2nd standard deviations from the average.
When price makes a large move toward the upside or downside, the outer bands expand in both directions, taking into account the 2nd standard deviation ranges of price based on its current volatility. Likewise, when price moves within a close range, the bands narrow as there is little volatility.
This last point is critical to the tactic we are about to present: since we are looking for relatively “extreme” levels, which can only be judged relative to context, we want to avoid trading during a period in which the bands are narrow.
It goes without saying that there are many ways to trade Bollinger Bands, and what we are about to present is just one of many methods to use this indicator.
Using Pin Bars to Gauge Potential Reversals
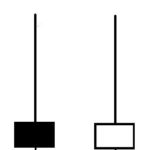
Pin bars are characterized by a “real” body (the distance between the open and close) that is much smaller than its corresponding wick.
The pin bars below show strong “buying pressure.” Regardless of their close–the bar on the left closed down, while the one on the left closed up—what is important here is that price sold off deeply but then was pushed back toward the opening price by a tremendous volume of buyers. Hence, these bars may indicate a “bullish” bias.
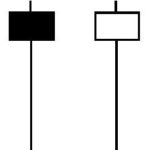
The next set of pin bars are the exact opposite of the previous set: buying pressure countered by even stronger selling pressure, indicating a “bearish” bias.
Combining Bollinger Bands with Pin Bars
By now, you might have figured out what this particular trading method is looking for: pin bars that penetrate the outer Bollinger Bands, and that show selling pressure at the top and buying pressure at the bottom.
If that sounds confusing, let’s break it down as a set of trading rules.
The Trading Rules:
- Identify a market that is exhibiting volatile movements within a trading range.
- Short trade: If you locate a bearish pin bar that penetrates the upper band, place a sell stop one tick below the bar’s low and a stop loss (buy stop) one tick above the high at the close of the market. Exit trade once a bar touches the middle band or at the close of the session in which the middle band had been touched. If the middle band isn’t reached in the next three sessions, then your trade exit is completely up to your discretion (the longer you hold, the greater the potential risk).
- Long trade: If you locate a bullish pin bar that penetrates the lower band, place a buy stop one tick above the bar’s high and a stop loss (sell stop) one tick below the bar’s low at the close of the market. Exit trade once a bar touches the middle band or at the close of the session in which the middle band had been touched. If the middle band isn’t reached in the next three sessions, then your trade exit is completely up to your discretion (the longer you hold, the greater the potential risk).
Hypothetical Trading Examples: Natural Gas Futures (NGQ2018)
NGQ2018 Daily Chart from January 24, 2018 to June 28, 2018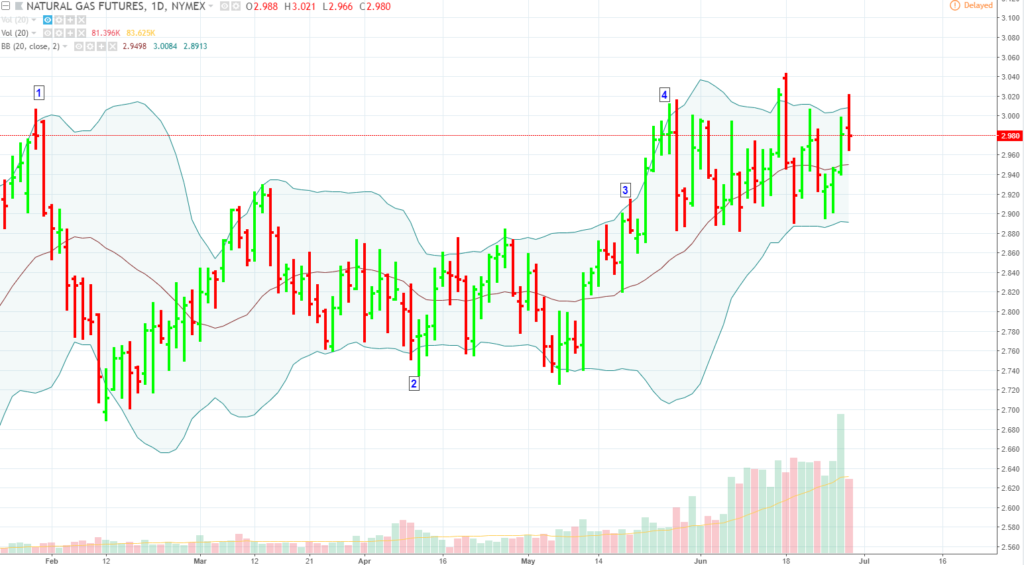
Trade (1): January 30, 2018. A sell stop was placed and filled at 2.966. The short position was closed two sessions later at the closing price of 2.885 for a gain of 81 ticks.
Trade (2): April 11, 2018. This was a tricky trade because the middle band was very close to the pin bar that triggered the trade. A buy stop was placed and filled at 2.792. The long position was closed two sessions later at the closing price of 2.824 for a gain of 32 ticks.
Trade (3): May 11, 2018. A sell stop was placed and filled at 2.880. The market continued to move higher and the position was stopped out at the stop loss (one tick above the high of the pin bar) at 2.915 for a loss of -35 ticks.
Trade (4): May 25, 2018. A sell stop was placed and filled at 2.961. This was a tricky trade because the market reversed starting at the third trading session after the position had been opened and the Bollinger Bands began shifting upwards indicating the possibility of a new uptrend formation. Nevertheless, the stop loss remained untouched until the sixth trading session wherein the middle band was finally touched. The short position was closed at the end of the sixth trading session at the price of 2.907, a gain of 54 ticks.
In this scenario, the cumulative result was a gain of 132 ticks. Note that this method will have its losses at other times or in different markets. This method or tactic does not claim to stack the odds in favor of a profitable result. It does, however, seek to add clarity to the interpretation of price movements beyond the 2nd standard deviation.
HYPOTHETICAL PERFORMANCE RESULTS HAVE MANY INHERENT LIMITATIONS, SOME OF WHICH ARE DESCRIBED BELOW. NO REPRESENTATION IS BEING MADE THAT ANY ACCOUNT WILL OR IS LIKELY TO ACHIEVE PROFITS OR LOSSES SIMILAR TO THOSE SHOWN. IN FACT, THERE ARE FREQUENTLY SHARP DIFFERENCES BETWEEN HYPOTHETICAL PERFORMANCE RESULTS AND THE ACTUAL RESULTS SUBSEQUENTLY ACHIEVED BY ANY PARTICULAR TRADING PROGRAM.
ONE OF THE LIMITATIONS OF HYPOTHETICAL PERFORMANCE RESULTS IS THAT THEY ARE GENERALLY PREPARED WITH THE BENEFIT OF HINDSIGHT. IN ADDITION, HYPOTHETICAL TRADING DOES NOT INVOLVE FINANCIAL RISK, AND NO HYPOTHETICAL TRADING RECORD CAN COMPLETELY ACCOUNT FOR THE IMPACT OF FINANCIAL RISK IN ACTUAL TRADING. FOR EXAMPLE, THE ABILITY TO WITHSTAND LOSSES OR TO ADHERE TO A PARTICULAR TRADING PROGRAM IN SPITE OF TRADING LOSSES ARE MATERIAL POINTS WHICH CAN ALSO ADVERSELY AFFECT ACTUAL TRADING RESULTS. THERE ARE NUMEROUS OTHER FACTORS RELATED TO THE MARKETS IN GENERAL OR TO THE IMPLEMENTATION OF ANY SPECIFIC TRADING PROGRAM WHICH CANNOT BE FULLY ACCOUNTED FOR IN THE PREPARATION OF HYPOTHETICAL PERFORMANCE RESULTS AND ALL OF WHICH CAN ADVERSELY AFFECT ACTUAL TRADING RESULTS.
There is a substantial risk of loss in trading futures, options and forex. Past performance is not necessarily indicative of future results.