Oscillators can be helpful for traders who are looking for potential “oversold” and “overbought” conditions in ultra-short time frames. But it can be tricky, because the notion of something being oversold or overbought is a matter of longer-term supply and demand.
Imagine trading a corn futures contract. There are no “real” oversold or overbought levels until the actual stock of all corn supplies is either drying up or in a glut. Yet, when trading in a short time frame, say in seconds or minutes, traders have to identify “relative” oversold or overbought conditions that have more to do with traders’ sentiment than real supply and demand. And that’s what oscillators are for: to help you identify those conditions.
The Stochastics Oscillator
Among the more popular oscillators is the Stochastics Oscillator. The purpose of this indicator is to help traders get on the right side of this sentiment-driven momentum. The oscillator is range bound between 0 and 100 and can be used to understand the underlying momentum accompanying the price action. This can be particularly useful on an intraday basis where the element of market noise is prevalent.
How Stochastics Are Calculated
Before we proceed to a strategy for intraday trading using stochastic, it’s important to know how it is calculated. The formula for stochastic is:
- %K = ( C- L14 ) / (H14−L14)×100 where
- C = The most recent closing price.
- 14 = Look back period, used as standard.
- L14 = The lowest price traded of the 14 look back trading sessions.
- H14 = The highest price traded during the same14-day period.
- %K = The current value of the stochastic indicator also referred to as fast stochastic.
- %D = The “slow” stochastic indicator is taken as a 3-period moving average of %K.
Since it is an oscillator, a reading of 0 is considered oversold and of 100 as overbought.
Buy signals are generated when the security becomes oversold, %K line crosses above %D line and goes above 0. The simple idea behind the signal is to indicate the change in momentum from down to up, as the fast stochastic %K crosses above %D.
The same applies to considering a short trade. It’s generally considered preferable to trade in the direction of the trend appearing in a higher timeframe OR at least one higher timeframe must be in sync while initiating the trade.
It must be noted that the signal generated is for the main time period (your main chart time frame). Entry and exit rules should be strictly followed and look for a risk: reward of at least 1:1 before considering initiating a trade.
Hypothetical Trade Using Stochastics
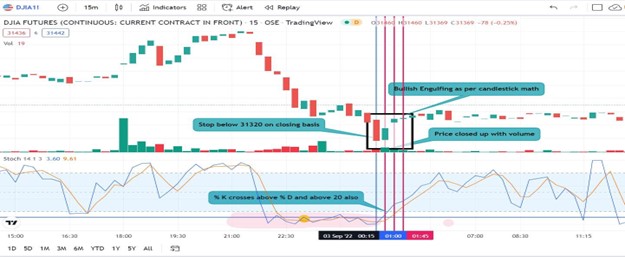
[ABOVE] The buy signal was generated on 15 minutes chart with %K crossing %D and going above 20 and also 01:15 – 01:45 ( 3 candles combined ) forming bullish engulfing after a downtrend in the 15 minutes chart.
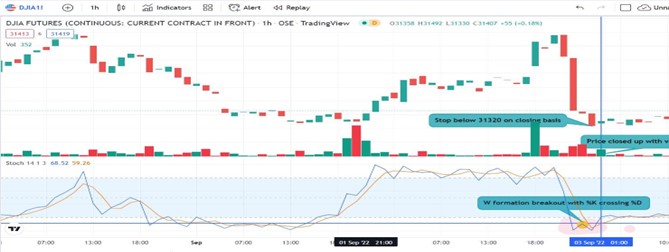
[ABOVE] At the same time in the 1hr chart stochastic formed the W pattern and gave a breakout above the middle point of W on 3rd Sept 2022 at 01.00. With both the charts giving confluence of buy signals entry can be initiated at the closing price viz.31351 with stop loss* below the closing price of the previous candle viz.31320. The flowing parameters pertaining to trade must be considered simultaneously:
- Risk – 130 points
- Target – 130 points viz. 31481
- Risk: Reward – 1:1
Be aware that stochastics can sometimes give false signals in volatile markets. So, remain vigilant and don’t rely 100% on this oscillator (or any single indicator for that matter).
The Bottom Line
Trading “relative” supply and demand verging on market noise can be tricky. Stochastics might help you distinguish real “signals” within the fuzziness of short-term market chaos. As helpful as it can be in this narrow time environment, you might want to consider using other indicators in combination to help you better identify higher-probability trading signals. Also, be sure your money management strategy is tight, especially when scalping the markets, as prices can often be volatile when trading minute – or second – ranges on the chart.
Please be aware that the content of this blog is based upon the opinions and research of GFF Brokers and its staff and should not be treated as trade recommendations. There is a substantial risk of loss in trading futures, options and forex. Past performance is not necessarily indicative of future results.
*Be advised that there are instances in which stop losses may not trigger. In cases where the market is illiquid–either no buyers or no sellers–or in cases of electronic disruptions, stop losses can fail. And although stop losses can be considered a risk management (loss management) strategy, their function can never be completely guaranteed.
Disclaimer Regarding Hypothetical Performance Results: HYPOTHETICAL PERFORMANCE RESULTS HAVE MANY INHERENT LIMITATIONS, SOME OF WHICH ARE DESCRIBED BELOW. NO REPRESENTATION IS BEING MADE THAT ANY ACCOUNT WILL OR IS LIKELY TO ACHIEVE PROFITS OR LOSSES SIMILAR TO THOSE SHOWN. IN FACT, THERE ARE FREQUENTLY SHARP DIFFERENCES BETWEEN HYPOTHETICAL PERFORMANCE RESULTS AND THE ACTUAL RESULTS SUBSEQUENTLY ACHIEVED BY ANY PARTICULAR TRADING PROGRAM.
ONE OF THE LIMITATIONS OF HYPOTHETICAL PERFORMANCE RESULTS IS THAT THEY ARE GENERALLY PREPARED WITH THE BENEFIT OF HINDSIGHT. IN ADDITION, HYPOTHETICAL TRADING DOES NOT INVOLVE FINANCIAL RISK, AND NO HYPOTHETICAL TRADING RECORD CAN COMPLETELY ACCOUNT FOR THE IMPACT OF FINANCIAL RISK IN ACTUAL TRADING. FOR EXAMPLE, THE ABILITY TO WITHSTAND LOSSES OR TO ADHERE TO A PARTICULAR TRADING PROGRAM IN SPITE OF TRADING LOSSES ARE MATERIAL POINTS WHICH CAN ALSO ADVERSELY AFFECT ACTUAL TRADING RESULTS. THERE ARE NUMEROUS OTHER FACTORS RELATED TO THE MARKETS IN GENERAL OR TO THE IMPLEMENTATION OF ANY SPECIFIC TRADING PROGRAM WHICH CANNOT BE FULLY ACCOUNTED FOR IN THE PREPARATION OF HYPOTHETICAL PERFORMANCE RESULTS AND ALL OF WHICH CAN ADVERSELY AFFECT ACTUAL TRADING RESULTS.