A market is trending and you’re looking to get in on a position at the next pullback. What’s the likelihood that the market might continue moving in your favor once you’re in a position? What if the pullback turns into a full-on reversal?
Gauging momentum can be tricky, but there are many indicators to use. One angle you can take is from the position of money flowing into or out of an asset. After all, price movements are driven by the inflows or outflows of funds. So, let’s take a moment to look at one indicator that’s designed specifically to gauge the flow of funds: the Chaikin Money Flow.
What is the Chaikin Money Flow?
Chaikin Money Flow (CMF) measures the amount of money flow volume over a specific period. It uses the Chaikin Accumulation Distribution calculation for each day. And that’s calculated by finding the sum to the all AD’s over the past 21 days and dividing that sum by the total volume over a 21-day period.
There are three steps in calculating the Chaikin Money Flow,
Firstly, the money flow multiplier is calculated, i.e. [(Close – Low) – High – Close)] / (High – Low)
Secondly, money flow volume is calculated, i.e. Money Flow Multiplier x Volume for the Current Period.
Thirdly, Chaikin Money Flow is calculated, i.e. 21 period Sum of Money Flow Volume / 21 period Sum of Volume.
This produces an oscillator that fluctuates between -1 and +1 with 0 as the centerline. The oscillators rise above zero when an upward trend begins and declines below zero when the trend turns downward.
How to Use the Chaikin Money Flow
In Figure 1.1 Looking at the hourly chart of (hypothetical) asset XYZ, rising prices are coinciding with CMF values above 0 & falling prices are coinciding with CMF values below 0. A buy trade can be initiated when the oscillator crosses the zero line from below and a sell trade can be initiated when the oscillator crosses the zero line from above.
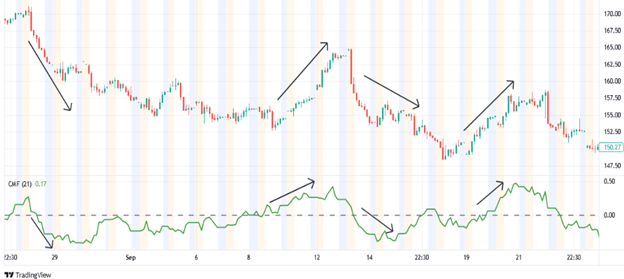
Figure 1.1 Asset XYZ hourly chart 28th August 2022 to 21st September 2022 & the Chaikin money flow in the bottom panel.
In the above example a trader would always be in a trade, however a trader can always choose to exit the trade by analyzing the asset for overbought and oversold levels and exiting when the CMF touches those levels. In this way a trader can avoid the risk of being in the market all the time.
In Figure 1.2 The overbought and oversold levels were kept at +40 and -40 levels respectively, and note that by exiting the trade at overbought and oversold levels a trader could attempt to avoid giving back much of the unrealized gains. However, the overbought and oversold levels are chosen randomly in this example, the trader should always examine the historical performance of the asset and adjust the levels accordingly.
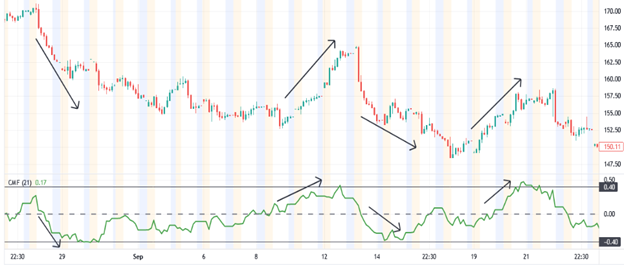
Figure 1.2 Asset XYZ hourly chart 28th August 2022 to 21st September 2022 with overbought and oversold levels at 0.40.
It should be noted that the CMF line can also cross the zero line too often before signaling the direction of the trend. To avoid these false signals a trader can use a certain threshold value around the zero line and enter the trade only if the CMF passes that threshold value.
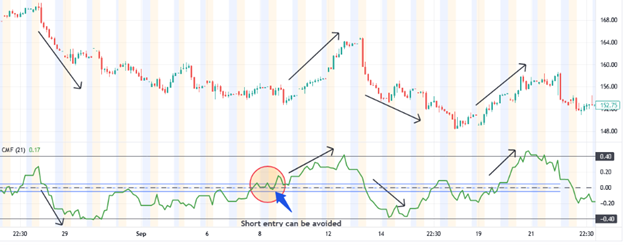
Figure 1.3 Asset XYZ hourly chart 28th August 2022 to 21st September 2022 with overbought and oversold levels at 0.40 and a threshold of 0.05 on either side of the zero line.
Notice in Figure 1.3 by having a threshold value of 0.05 on either side of the zero line, on 8th of September 2022, the short entry could have been avoided.
As the Chaikin money flow calculation is built upon the Accumulation Distribution indicator, the limitations of the gap still exist. This may result in CMF and price being out of sync. As with all indicators, CMF should NOT be used as a standalone indicator, but rather be used in conjunction with other indicators and technical analysis.
The Bottom Line
When using technical analysis to trade a market, you’re looking at various things simultaneously, like chart patterns, critical support and resistance levels, trend, momentum, etc. The Chaikin Money Flow oscillator can help you home in on the “momentum” aspect of price action. Capital inflows and outflows have a direct effect on price movements. Price action, itself, is a reflection of these capital movements. But to analyze the flow of money over time, you will need a tool that’s designed to observe these inflows/outflows. That’s what this indicator is designed to do. If you use it in conjunction with other indicators, it may provide you with a more comprehensive picture of the asset you’re trading.
Please be aware that the content of this blog is based upon the opinions and research of GFF Brokers and its staff and should not be treated as trade recommendations. There is a substantial risk of loss in trading futures, options and forex. Past performance is not necessarily indicative of future results.
Disclaimer Regarding Hypothetical Performance Results: HYPOTHETICAL PERFORMANCE RESULTS HAVE MANY INHERENT LIMITATIONS, SOME OF WHICH ARE DESCRIBED BELOW. NO REPRESENTATION IS BEING MADE THAT ANY ACCOUNT WILL OR IS LIKELY TO ACHIEVE PROFITS OR LOSSES SIMILAR TO THOSE SHOWN. IN FACT, THERE ARE FREQUENTLY SHARP DIFFERENCES BETWEEN HYPOTHETICAL PERFORMANCE RESULTS AND THE ACTUAL RESULTS SUBSEQUENTLY ACHIEVED BY ANY PARTICULAR TRADING PROGRAM.
ONE OF THE LIMITATIONS OF HYPOTHETICAL PERFORMANCE RESULTS IS THAT THEY ARE GENERALLY PREPARED WITH THE BENEFIT OF HINDSIGHT. IN ADDITION, HYPOTHETICAL TRADING DOES NOT INVOLVE FINANCIAL RISK, AND NO HYPOTHETICAL TRADING RECORD CAN COMPLETELY ACCOUNT FOR THE IMPACT OF FINANCIAL RISK IN ACTUAL TRADING. FOR EXAMPLE, THE ABILITY TO WITHSTAND LOSSES OR TO ADHERE TO A PARTICULAR TRADING PROGRAM IN SPITE OF TRADING LOSSES ARE MATERIAL POINTS WHICH CAN ALSO ADVERSELY AFFECT ACTUAL TRADING RESULTS. THERE ARE NUMEROUS OTHER FACTORS RELATED TO THE MARKETS IN GENERAL OR TO THE IMPLEMENTATION OF ANY SPECIFIC TRADING PROGRAM WHICH CANNOT BE FULLY ACCOUNTED FOR IN THE PREPARATION OF HYPOTHETICAL PERFORMANCE RESULTS AND ALL OF WHICH CAN ADVERSELY AFFECT ACTUAL TRADING RESULTS.