- GMMA shows market sentiment by contrasting short-term and long-term investor perspectives with two sets of EMAs.
- GMMA ribbons can help traders identify uptrends, downtrends, and consolidation phases by analyzing the interaction and distance between short-term and long-term ribbons.
- This indicator, combined with others, helps make more informed trading decisions based on market psychology.
Most traders are familiar with moving averages. They help traders gauge the direction and momentum of trends. But what if moving averages could provide insight to help gauge market sentiment in the short-term (trading) and longer-term (investing) crowds?
Enter the Guppy Multiple Moving Average (GMMA, a type of moving average ribbon). This takes moving averages a step further by offering a glimpse into the psychology of these two classes of market participants. Here, we’ll unravel some of the intricacies of the GMMA and demonstrate how to use it.
What is the GMMA and What Does It Represent?
The GMMA system is a meticulous assembly of twelve exponential moving averages, designed to give insight into the mindsets of two main market players: short-term traders and long-term institutional investors. At its core, the GMMA illustrates market sentiment by visualizing these two groups’ dynamics and their potential effects on price movement.
The Anatomy of a GMMA Ribbon
Think of it as two distinct groups or “ribbons” of exponential moving averages (EMAs):
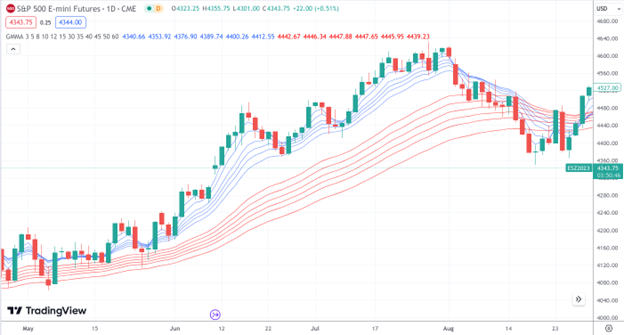
- Short-Term Ribbon: This is made up of the 3, 5, 8, 10, 12, and 15-day EMAs. This ribbon reflects the sentiment and strategies of short-term traders. And as you know, these trader types are often nimble and capitalizing on fleeting opportunities.
- Long-Term Ribbon: This section comprises the 30, 35, 40, 45, 50, and 60-day EMAs. This ribbon offers insights into the decisions of long-term investors or institutions. Their movements are often informed by in-depth fundamental research and analysis, and we can assume that their actions are a bit more deliberate.
- Space Between Ribbons: The space between the 15-day EMA and the 30-day EMA is intriguing. It serves as a kind of ‘no man’s land’, setting apart the two groups and providing hints about a stock’s overall momentum.
How Do You Interpret the GMMA?
The GMMA presents three general scenarios:
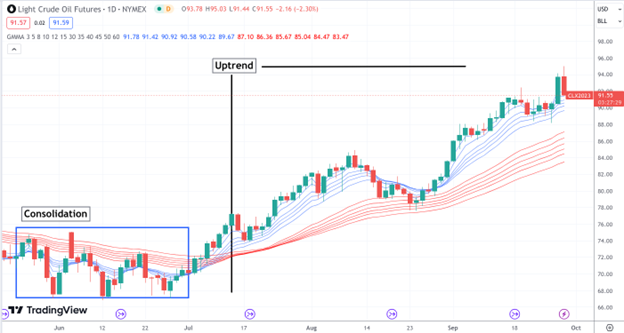
Uptrend Insights: If the short-term ribbon crosses and stays above the long-term ribbon, a budding uptrend might be at play. The broader the gap between the two ribbons, the more robust the uptrend. This typically indicates short-term traders are ahead of the curve, acting before their long-term counterparts.
Downtrend Clues: A potential downtrend is hinted when the short-term ribbon drifts below the long-term one. A wider separation suggests a stronger trend, indicating early exits by short-term traders while long-term investors weigh their next moves.
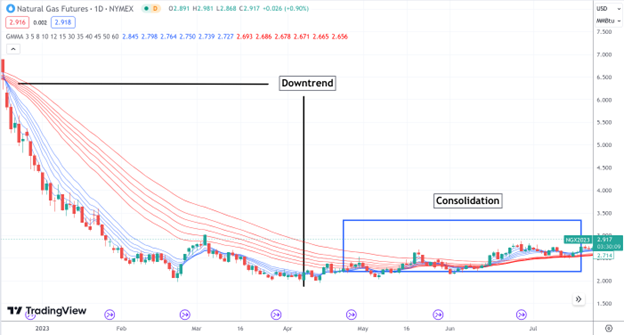
Consolidation Phase: When the two ribbons seem to intertwine, it points to a phase of agreement between the two market factions. This typically results in a sideways movement, revealing no prevailing trend.
How to Use the GMMA
Like most indicators, the GMMA is not a stand-alone magic wand. However, it can provide valuable cues:
- Going Long: Consider this when short-term ribbons cross above long-term ones. Waiting for a breakout that tests the longer-term ribbon’s resilience can be a smart move.
- Going Short: The inverse applies for bearish trends. When short-term ribbons descend below the long-term ones, it could be time to short.
- Anticipating Breakouts: Periods when the ribbons compress suggest low volatility but also hint at an impending price breakout. While the GMMA provides a closer look, it’s crucial to zoom out occasionally, ensuring the broader market scenario isn’t overlooked.
Let us use the Micro E-Mini Dow (MYM) as an illustration.
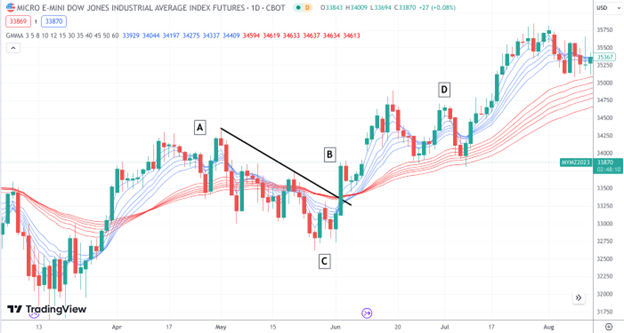
- A: The MYM pulls back from a previous upside breakout.
- B: Price break out to the upside and the short-term ribbon crosses above the long-term ribbon.
- C: A trader might have placed a stop loss below the most recent swing low.
- D: Although prices pull back, the distance between the two ribbons is pronounced and the distance between EMAs in the long-term ribbon appears to be expanding and not contracting. The decision here is to remain in the trade and continue riding the upside.
There are many ways to interpret the GMMA and it will vary on a situational basis. In addition to using the GMMA as a setup in itself, you can also adapt the GMMA to fit your trading strategy. As in the example above, we used it to inform a simple breakout trade in which it helped us decided whether to close or continue the trade after the second pullback.
The Bottom Line
The GMMA, with its dual-ribbon system, offers traders a vantage point to perceive market sentiment through the lens of both short-term traders and long-term institutional players. When coupled with other technical tools, it can be a formidable addition to a trader’s toolkit, paving the way for more nuanced trading decisions. Always remember: no single tool offers the full picture. The real magic lies in knowing how to interweave multiple perspectives.
Please be aware that the content of this blog is based upon the opinions and research of GFF Brokers and its staff and should not be treated as trade recommendations. There is a substantial risk of loss in trading futures, options and forex. Past performance is not necessarily indicative of future results.
Be advised that there are instances in which stop losses may not trigger. In cases where the market is illiquid–either no buyers or no sellers–or in cases of electronic disruptions, stop losses can fail. And although stop losses can be considered a risk management (loss management) strategy, their function can never be completely guaranteed.
Disclaimer Regarding Hypothetical Performance Results: HYPOTHETICAL PERFORMANCE RESULTS HAVE MANY INHERENT LIMITATIONS, SOME OF WHICH ARE DESCRIBED BELOW. NO REPRESENTATION IS BEING MADE THAT ANY ACCOUNT WILL OR IS LIKELY TO ACHIEVE PROFITS OR LOSSES SIMILAR TO THOSE SHOWN. IN FACT, THERE ARE FREQUENTLY SHARP DIFFERENCES BETWEEN HYPOTHETICAL PERFORMANCE RESULTS AND THE ACTUAL RESULTS SUBSEQUENTLY ACHIEVED BY ANY PARTICULAR TRADING PROGRAM.
ONE OF THE LIMITATIONS OF HYPOTHETICAL PERFORMANCE RESULTS IS THAT THEY ARE GENERALLY PREPARED WITH THE BENEFIT OF HINDSIGHT. IN ADDITION, HYPOTHETICAL TRADING DOES NOT INVOLVE FINANCIAL RISK, AND NO HYPOTHETICAL TRADING RECORD CAN COMPLETELY ACCOUNT FOR THE IMPACT OF FINANCIAL RISK IN ACTUAL TRADING. FOR EXAMPLE, THE ABILITY TO WITHSTAND LOSSES OR TO ADHERE TO A PARTICULAR TRADING PROGRAM IN SPITE OF TRADING LOSSES ARE MATERIAL POINTS WHICH CAN ALSO ADVERSELY AFFECT ACTUAL TRADING RESULTS. THERE ARE NUMEROUS OTHER FACTORS RELATED TO THE MARKETS IN GENERAL OR TO THE IMPLEMENTATION OF ANY SPECIFIC TRADING PROGRAM WHICH CANNOT BE FULLY ACCOUNTED FOR IN THE PREPARATION OF HYPOTHETICAL PERFORMANCE RESULTS AND ALL OF WHICH CAN ADVERSELY AFFECT ACTUAL TRADING RESULTS.