DEFINITION: A yield curve is a line that shows you the “spread” between yields (aka interest rates) of two bonds that are equal in credit quality yet differ in maturity dates. The slope of the curve is a harbinger of future economic conditions.
What is a yield curve?
A bond yield is the percentage of interest it pays bond holders. As you know, bond yields change over time. They slope, sometimes upwards, sometimes flat, and sometimes downwards.
When you hear about the yield curve, most of the time it refers to the “spread” (or difference) between two US Treasury yields compared with one another. This spread can be between the 2-year, 5-year, 10-year, or 30-year Treasury debt instrument.
In principle, a “normal curve” is one in which the bond with the later maturity date has a higher yield than the bond with the near-term maturity date. Hence, the 30-year normally has a higher yield than the 10-year. Same goes for the 10-year and the 2-year.
When the yield curve inverts, it means that the shorter-term bond yields a higher interest rate return than the longer-term bond. As a borrower, it costs more to pay off a shorter-term loan than it does a loan that matures much later in time.
The infamous inverted yield curve
Every now and then, there’s a raucous that gets blasted across financial media as if some monstrous anomaly has been detected on the horizon. It’s the infamous yield curve. With all the anxiety it seemingly brings, most investors and traders can tell it’s a big deal. Yet most don’t really understand why. Let’s break it down for you.
Okay, the yield curve is inverted. So what?
Take a look at the following 2-year and 10-year Treasury yield curves:
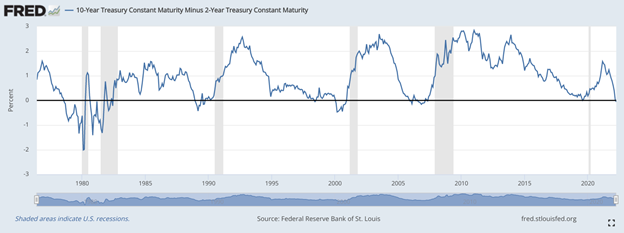
Notice that every time the curve inverts (dips below the midpoint line indicating zero) a recession follows.
Here’s a close up of the yield curve from May 2019 to the present:
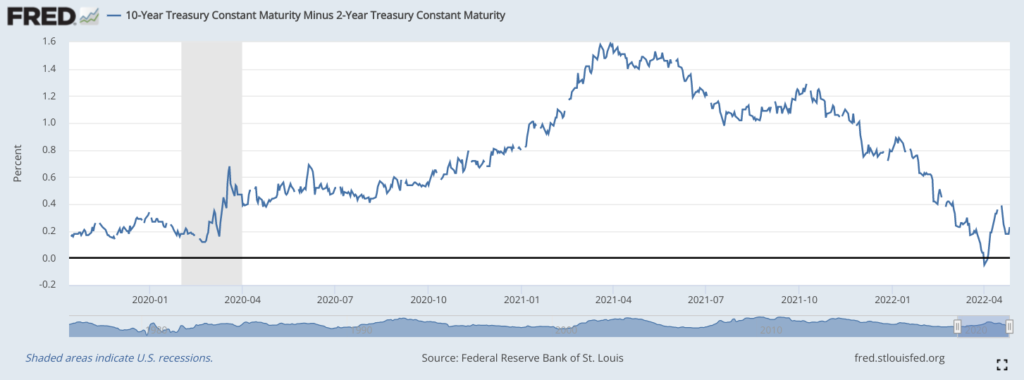
The yield curve inverted slightly in August 2019, followed by a recession, and is once again inverted.
There’s no such thing as a crystal ball to predict economic downturns, but the yield curve comes pretty close. And that’s why it’s a big deal.
How does that work, exactly?
There are a few of ways to explain this:
The first is that the “collective wisdom” of the markets anticipates what central banks will do in the near term versus the long term. For instance, if investors anticipate growth in the long-term, they expect bonds to yield higher interest rates to cap inflationary pressures (resulting from low interest rates). You can read more about this complex rationale here.
Cutting to the chase…
- A steepening yield curve is often a harbinger for growth and economic expansion.
- A flattening yield curve often signals a slowdown and possibly a recession.
- And an inverted yield curve almost always precedes a recession.
The second explanation is a reaction to the first. The direction of the curve direction “triggers” the responses (in the bullet points) above because investors believe the signals are harbingers of growth, slowdown, or recession. In short, it becomes a self-fulfilling prophecy.
A third explanation of the inverted yield curve is this: there’s more “foreign” money flowing into long-term than short-term US Treasuries, pushing longer-term yields below shorter-term yields (thereby causing an inversion). This scenario has nothing to do with predicting booms and busts; it’s just an outcome of supply and demand.
It’s still a bit fuzzy
For most people, this isn’t the easiest thing to wrap your head around. And this isn’t the only explanation out there (banks have a different take on it; one that concerns the effect of yield curves on their profit potential). But for now, this is a pretty good, albeit very general, summary of yield curves and what they indicate.
Please be aware that the content of this blog is based upon the opinions and research of GFF Brokers and its staff and should not be treated as trade recommendations. There is a substantial risk of loss in trading futures, options and forex. Past performance is not necessarily indicative of future results.