Gold is up 22.7% year to date, topping the S&P 500 index’ (10.5%) by double, and trailing the Nasdaq 100, up 35.6%, by roughly 13%. Like all three major equity indices, gold has also pulled back. Depending on whether you’re looking to gold for a short-term or long-term trade, you’re probably wondering what levels may mark the end or continuation of gold’s uptrend, and what technical and fundamental drivers may determine the yellow metal’s performance in the weeks and months to come.
That’s what we’re going to cover. Let’s start with the technical picture.
A Technical Snapshot
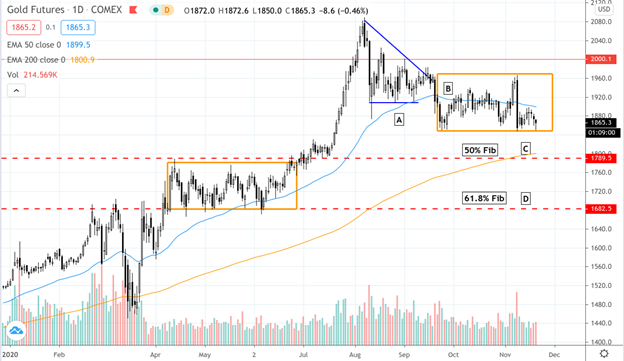
Gold Futures (GC) December 31, 2019 to November 18, 2020 (Source: Tradingview)
GC reached an all-time-high–2089.00–on August 7, 2020. By September, we began seeing a descending triangle formation [A] which ended up breaking down on September 21.
Following this breakdown, gold fell into a wide trading range [B} between resistance at around 1966.00 and support at 1848.00. These two levels mare near-term critical support and resistance levels–a break above may signal a potential resumption of gold’s uptrend while a break below may find support in lower intermediate-term levels.
If gold breaks below the current rectangle formation, might this threaten its upward momentum? Technically, no. If you follow Fibonacci retracement principles, gold can go as low as 61.8%, to the price of 1780 [D] before its technical uptrend is in question. Note that this level also coincides with previous support from April to June (see previous rectangle range). There’s also Fib support at 50% [C] though it may not be as strong a support level as 61.8%, simple because that was a disputed range in which buyers prevailed, sending the metal toward its record highs.
That’s the technical scenario, and it casts a few possibilities for near-term price action. But what might we expect from a longer-term perspective? The likely direction is toward the upside.
The Fundamental Picture
Why do investors buy gold? Traditionally, it’s viewed as a hedge–against inflation, dollar devaluation, purchasing power erosion, economic uncertainty, and negative market volatility (this sometimes works). It’s traditionally a “safe haven” asset.
Looking ahead, what do we have before us? Let’s start with the mega picture. According to a recent Institute of International Finance report, global debt is about to reach $277 trillion by the end of the year. That’s 432% of GDP ratio for developed nations and a 250% of GDP for emerging nations. Debt–especially at such high levels where it engulfs your GDP–has to be deleveraged. So, ask yourself: how is it going to do this? How do countries and major institutions continue to make interest payments when their capacity to generate revenue is trailing their increasing debt loads? Answer: loose monetary policy.
The pandemic has brought an unprecedented onslaught of fiscal and monetary measures aimed at stemming its negative effects on the economy. Liquidity in the financial markets “must” be maintained; and so far, the US has avoided a potential depression-like scenario. So, what’s the forecast? It’s hard to tell, as the pandemic is not over. Are we to expect more fiscal and monetary measures?
The Federal Reserve also changed its 2% inflation target framework to a 2% “average” inflation target. Meaning, it’s looking to stimulate inflation in an effort to avoid an increasingly “deflationary” scenario. What does this mean? Simply put, we’re looking at an increase in inflation (that’s the point of the Fed changing the framework).
Higher inflation paired with fiscal spending and low interest rates mean potential dollar devaluation, purchasing power erosion, and a higher cost of living. Gold often moves inverse to these developments. Add to the mix the uncertainty of the pandemic, and you’ve got–at the least–a fundamental reason for investors to consider a “flight to safety.” Only time will tell how gold will move in the long term.
Please be aware that the content of this blog is based upon the opinions and research of GFF Brokers and its staff and should not be treated as trade recommendations. There is a substantial risk of loss in trading futures, options and forex. Past performance is not necessarily indicative of future results.
Disclaimer Regarding Hypothetical Performance Results: HYPOTHETICAL PERFORMANCE RESULTS HAVE MANY INHERENT LIMITATIONS, SOME OF WHICH ARE DESCRIBED BELOW. NO REPRESENTATION IS BEING MADE THAT ANY ACCOUNT WILL OR IS LIKELY TO ACHIEVE PROFITS OR LOSSES SIMILAR TO THOSE SHOWN. IN FACT, THERE ARE FREQUENTLY SHARP DIFFERENCES BETWEEN HYPOTHETICAL PERFORMANCE RESULTS AND THE ACTUAL RESULTS SUBSEQUENTLY ACHIEVED BY ANY PARTICULAR TRADING PROGRAM.
ONE OF THE LIMITATIONS OF HYPOTHETICAL PERFORMANCE RESULTS IS THAT THEY ARE GENERALLY PREPARED WITH THE BENEFIT OF HINDSIGHT. IN ADDITION, HYPOTHETICAL TRADING DOES NOT INVOLVE FINANCIAL RISK, AND NO HYPOTHETICAL TRADING RECORD CAN COMPLETELY ACCOUNT FOR THE IMPACT OF FINANCIAL RISK IN ACTUAL TRADING. FOR EXAMPLE, THE ABILITY TO WITHSTAND LOSSES OR TO ADHERE TO A PARTICULAR TRADING PROGRAM IN SPITE OF TRADING LOSSES ARE MATERIAL POINTS WHICH CAN ALSO ADVERSELY AFFECT ACTUAL TRADING RESULTS. THERE ARE NUMEROUS OTHER FACTORS RELATED TO THE MARKETS IN GENERAL OR TO THE IMPLEMENTATION OF ANY SPECIFIC TRADING PROGRAM WHICH CANNOT BE FULLY ACCOUNTED FOR IN THE PREPARATION OF HYPOTHETICAL PERFORMANCE RESULTS AND ALL OF WHICH CAN ADVERSELY AFFECT ACTUAL TRADING RESULTS.