Strong GDP Growth Dampens Gold’s Shine While Housing Market Woes Persist
The price of gold has been on the downtrend and is threatening to fall below the $1,900 support line. The US economy showed stronger than expected growth in the second quarter, which is putting downward pressure on gold prices.
Positive GDP Puts Pressure on Gold
The GDP grew by 2.0% for the first quarter of 2023 according to the most recent GDP report from June 29th, higher than the predicted 1.4%, primarily due to increases in exports and consumer spending. With all of this positive economic data on June 29th, August gold futures dropped to a low of 1900.6 yesterday (6/29/23).
Gold’s response to growth shouldn’t be that surprising. Positive economic growth diminishes the appeal of gold as a safe-haven asset and gives the Federal Reserve a little more space to raise interest rates to control inflation. Remember, higher interest rates means a stronger dollar, and that tends to take away from gold’s shine.
Housing Market Isn’t Doing Well, But That Didn’t Seem to Impact Gold
In contrast, the US housing market isn’t doing as well. The number of consumers looking to buy new homes has fallen for the third month in a row. However, this disappointing housing data doesn’t seem to be affecting gold prices significantly, as they continue to stay above the important $1900 per ounce level.
Interpreting Both Reports in Relation to Gold – A Cheat Sheet
In case you’re not quite making the connection, here’s one way to look at the fundamental impact of both reports in relation to the yellow metal.
US Housing Market
- If the housing market is strong, it signifies a healthy economy, decreasing the demand for gold, traditionally a safe-haven asset during economic uncertainty.
- In contrast, if the housing market is weak, it might increase economic uncertainty, potentially driving investors towards gold as a safety net, thereby raising its price.
GDP
- A strong GDP growth indicates a robust economy, which may lessen the demand for gold. Investors tend to move towards riskier investments in good economic times, reducing the demand for safe-haven assets like gold.
- Conversely, if GDP growth is weak or negative (recession), it could increase economic uncertainty. This might lead investors to move towards safer assets like gold, thereby increasing its price.
A caveat: These are just theoretical pathways. In real-world scenarios, many other factors also play a role in determining gold prices. So, be flexible in your interpretations to include variations to the above rules of thumb.
The Technical Picture
The picture looks bearish but there are signs of bullish resilience. Take a look.
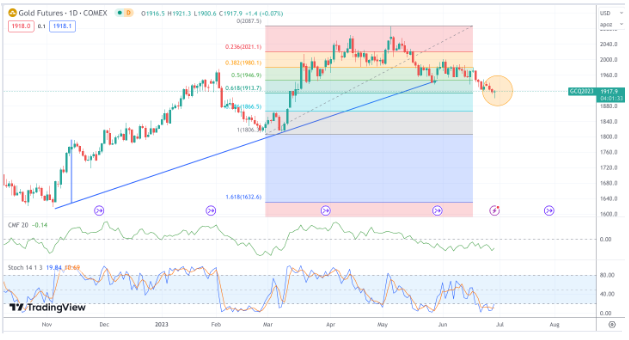
- The uptrend beginning in November 2022 has been broken as price continues to decline below it.
- The Chaikin Money Flow shows a reading below the zero line, indicating that selling pressure has overwhelmed the bulls.
- The Stochastic Oscillator places gold well in “oversold” territory, but could this be a mere breather before commencing on another leg down? Something to think about.
- The bullish factor here is that the Fibonacci retracement of 61.8% is holding…for now.
Where Might Gold Be Heading Next?
It’s clear gold bulls are trying to defend the 61.8% retracement range. $1,900 is a critical support line. If gold falls below this, the next major support level would be at around $1,800.
If you scan the internet for gold forecasts, you’ll get a scattershot of bullish price targets. These are all longer term targets, and they can vary widely. As a trader, monitor these analyst forecasts, but also remain flexible for the near-term events and surprises that can quickly change the near-term to intermediate-term picture.
The Bottom Line
Wrapping it all up, the strength of the US economy, as shown by better than expected growth, is making it tough for gold to stay above the key $1,900 level. But remember, how the economy and housing market affect gold isn’t always straightforward. Even though the housing market isn’t doing too well, it doesn’t seem to be giving gold the boost you might expect. And while charts and graphs might make things look a bit gloomy for gold, there are still folks who believe in its value. So, if you’re thinking about gold, keep an eye on what the experts are saying but also stay ready for surprises – because when it comes to the gold market in this volatile economic environment, it seems as if anything can happen.
Please be aware that the content of this blog is based upon the opinions and research of GFF Brokers and its staff and should not be treated as trade recommendations. There is a substantial risk of loss in trading futures, options and forex. Past performance is not necessarily indicative of future results.
Disclaimer Regarding Hypothetical Performance Results: HYPOTHETICAL PERFORMANCE RESULTS HAVE MANY INHERENT LIMITATIONS, SOME OF WHICH ARE DESCRIBED BELOW. NO REPRESENTATION IS BEING MADE THAT ANY ACCOUNT WILL OR IS LIKELY TO ACHIEVE PROFITS OR LOSSES SIMILAR TO THOSE SHOWN. IN FACT, THERE ARE FREQUENTLY SHARP DIFFERENCES BETWEEN HYPOTHETICAL PERFORMANCE RESULTS AND THE ACTUAL RESULTS SUBSEQUENTLY ACHIEVED BY ANY PARTICULAR TRADING PROGRAM.
ONE OF THE LIMITATIONS OF HYPOTHETICAL PERFORMANCE RESULTS IS THAT THEY ARE GENERALLY PREPARED WITH THE BENEFIT OF HINDSIGHT. IN ADDITION, HYPOTHETICAL TRADING DOES NOT INVOLVE FINANCIAL RISK, AND NO HYPOTHETICAL TRADING RECORD CAN COMPLETELY ACCOUNT FOR THE IMPACT OF FINANCIAL RISK IN ACTUAL TRADING. FOR EXAMPLE, THE ABILITY TO WITHSTAND LOSSES OR TO ADHERE TO A PARTICULAR TRADING PROGRAM IN SPITE OF TRADING LOSSES ARE MATERIAL POINTS WHICH CAN ALSO ADVERSELY AFFECT ACTUAL TRADING RESULTS. THERE ARE NUMEROUS OTHER FACTORS RELATED TO THE MARKETS IN GENERAL OR TO THE IMPLEMENTATION OF ANY SPECIFIC TRADING PROGRAM WHICH CANNOT BE FULLY ACCOUNTED FOR IN THE PREPARATION OF HYPOTHETICAL PERFORMANCE RESULTS AND ALL OF WHICH CAN ADVERSELY AFFECT ACTUAL TRADING RESULTS.