On May 29, 2023, innovative financial author, stock speculator, and entrepreneur William O’Neil passed away at the age of 90. In our last blog, we looked at the CAN SLIM approach that he developed and this week we are going to look at the famous ‘Cup and Handle’ pattern developed by William O’Neil. William O’Neil first introduced the concept of the ‘Cup and Handle’ (C&H) pattern in his 1988 book, “How to Make Money in Stocks” – this tool that can be used across various financial assets to anticipate potential market trends.
The pattern involves a four-stage process, each stage indicating a different movement in the price of the asset. While initially designed for long-term investment strategies, the Cup & Handle pattern can be modified for short-term trading, involving careful measurement, profit target setting, and strategic entry and exit points.
The great thing about the Cup & Handle pattern is that it’s a versatile tool that investors can use across the board, be it for futures, forex, cryptocurrencies, or virtually any financial asset that can be plotted on a chart, to anticipate potential market trends and make informed trading decisions.
Here’s a simpler way to understand the different stages of the cup and handle pattern:
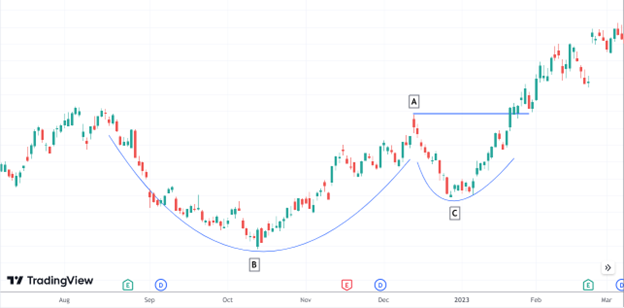
- 1st stage: the price of a stock reaches a high point after increasing rapidly over one to three months.
- 2nd stage: the price drops but not more than half of the increase it had before. It then slowly starts to go up again, creating a shape like the bottom of a cup.
- 3rd stage: the price tries to go up to the previous high point but fails, which results in another small drop. This forms a shape similar to the handle of a cup.
- 4th and final stage: the price goes back up to the previous high point for the second time and then increases even more. The amount it goes up is usually similar to the depth of the ‘cup’ part of the pattern.
In the hypothetical chart below, stages 1 and 2 are illustrated in the largest curved area (B). Stage 3 and 4 are illustrated in the smaller curve areas (A to C)
How to Trade a Cup & Handle Pattern
When O’Neil defined this pattern, it was meant for investors looking to enter an asset to hold for a prolonged period of time. As a short-term trader, you may have to modify your profit target to better match your trading goals.
Here’s one way to trade the pattern using a short-term approach:
- Measure the height of the pattern by subtracting the price at A from B.
- Determine whether you want to pursue 100% of that height for your profit target (or whether you aim to take profits before reaching 100% or after exceeding it).
- Enter a few ticks upon a break out of A.
- Place a stop loss a few ticks below the handle at C.
Examples – Trading the Cup & Handle Pattern
The name of this pattern, ‘Cup and Handle,’ derives from its visual similarity to a physical cup with a handle. This is a positive sign in trading, characterized by an initial decline in prices, followed by a period of consolidation and subsequent increase, forming a U-shape – the ‘cup’. After the cup formation, there is a slight decrease, confined mostly within a channel, creating the ‘handle’ of the pattern. Notably, this decline doesn’t go as low as the previous low point. The pattern completes when there’s an upward breakout, indicating a potential bullish market.
Here are the two fundamental strategies for trading the ‘Cup and Handle’ pattern:
- The more aggressive traders often place a stop buy order slightly above the upper trendline of the handle or channel. A break above this level typically indicates the pattern’s completion and the start of a bullish market trend. However, this approach carries a risk of false breakouts.
- Alternatively, some traders prefer to wait for the market to retest the trendline after the initial breakout, and then they enter the trade. This method reduces the risk of a false breakout, but the drawback is the possibility that the market may not retrace, thus preventing the trader from participating in the trade.
The potential profit target of a ‘Cup and Handle’ pattern is calculated by adding the distance from the bottom of the cup to the breakout level, to the breakout level itself. This gives a target level for the ensuing bullish trend.
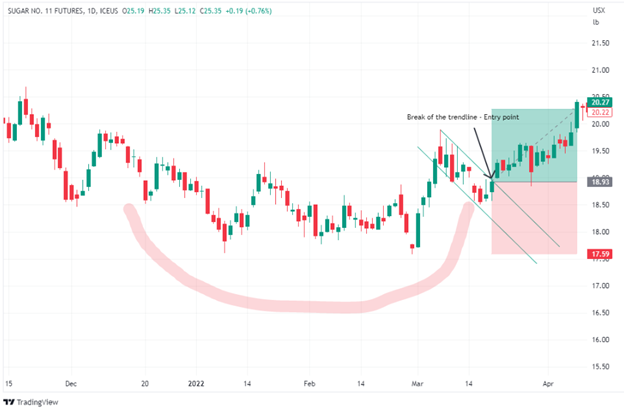
Examining the Sugar chart, we can distinctly identify the U-shaped price movement followed by a sharp downward trend within a channel. The point at which the price breaks out from this channel serves as the entry point for trading. The target, represented by the top of the green zone, is derived by calculating the distance from the bottom of the cup to the breakout point – this distance is visualized by the red zone in the chart.
However, like all technical trading patterns, additional indicators should be considered before making a trade decision. For instance, during the formation of the ‘handle’ part of the pattern, trading volume should be diminishing, and then rise upon the price breaking out from the channel. This change in volume can provide extra confirmation of the pattern’s validity.
The primary challenge associated with the ‘Cup and Handle’ pattern is its unpredictable formation time. While it typically forms over a span of one month to one year, this timeframe can vary significantly. It can form quickly or extend over multiple years, making its occurrence rather difficult to forecast accurately.
The Bottom Line
William O’Neil’s ‘Cup and Handle’ pattern is a robust tool that offers valuable insights into market trends, whether you’re looking at stocks, futures, forex, or cryptocurrencies. Introduced more than 30 years ago and explained in detail through O’Neil’s book and articles, the pattern’s four-stage process helps investors understand how an asset’s price might move. While initially meant for long-term investing, the pattern’s flexibility allows it to be adapted to short-term trading strategies as well. It’s all about measuring the pattern’s height, deciding on your profit target, and then wisely entering and exiting the market.
Please be aware that the content of this blog is based upon the opinions and research of GFF Brokers and its staff and should not be treated as trade recommendations. There is a substantial risk of loss in trading futures, options and forex. Past performance is not necessarily indicative of future results.
Be advised that there are instances in which stop losses may not trigger. In cases where the market is illiquid–either no buyers or no sellers–or in cases of electronic disruptions, stop losses can fail. And although stop losses can be considered a risk management (loss management) strategy, their function can never be completely guaranteed.
Disclaimer Regarding Hypothetical Performance Results: HYPOTHETICAL PERFORMANCE RESULTS HAVE MANY INHERENT LIMITATIONS, SOME OF WHICH ARE DESCRIBED BELOW. NO REPRESENTATION IS BEING MADE THAT ANY ACCOUNT WILL OR IS LIKELY TO ACHIEVE PROFITS OR LOSSES SIMILAR TO THOSE SHOWN. IN FACT, THERE ARE FREQUENTLY SHARP DIFFERENCES BETWEEN HYPOTHETICAL PERFORMANCE RESULTS AND THE ACTUAL RESULTS SUBSEQUENTLY ACHIEVED BY ANY PARTICULAR TRADING PROGRAM.
ONE OF THE LIMITATIONS OF HYPOTHETICAL PERFORMANCE RESULTS IS THAT THEY ARE GENERALLY PREPARED WITH THE BENEFIT OF HINDSIGHT. IN ADDITION, HYPOTHETICAL TRADING DOES NOT INVOLVE FINANCIAL RISK, AND NO HYPOTHETICAL TRADING RECORD CAN COMPLETELY ACCOUNT FOR THE IMPACT OF FINANCIAL RISK IN ACTUAL TRADING. FOR EXAMPLE, THE ABILITY TO WITHSTAND LOSSES OR TO ADHERE TO A PARTICULAR TRADING PROGRAM IN SPITE OF TRADING LOSSES ARE MATERIAL POINTS WHICH CAN ALSO ADVERSELY AFFECT ACTUAL TRADING RESULTS. THERE ARE NUMEROUS OTHER FACTORS RELATED TO THE MARKETS IN GENERAL OR TO THE IMPLEMENTATION OF ANY SPECIFIC TRADING PROGRAM WHICH CANNOT BE FULLY ACCOUNTED FOR IN THE PREPARATION OF HYPOTHETICAL PERFORMANCE RESULTS AND ALL OF WHICH CAN ADVERSELY AFFECT ACTUAL TRADING RESULTS.
GFF Brokers is a member of NFA and is subject to NFA’s regulatory oversight and examinations. However, you should be aware that NFA does not have regulatory oversight authority over underlying or spot virtual currency products or transactions or virtual currency exchanges, custodians or markets.
Notice from CFTC: Customer Advisory: Understand the Risks of Virtual Currency Trading
Notice from NFA: NFA Investor Advisory—Futures on Virtual Currencies Including Bitcoin