Finding short-term turning points: As a trader, you’re probably aware of the Relative Strength Index (RSI). It is the momentum indicator that measures the speed and magnitude a price changes relative to an “overvalued” and “undervalued” level.
The range for overvalued varies according to a trader’s preference (some say its 70 and above). Likewise, many traders consider RSI reading below 30 to be undervalued. This is, of course, subjective.
Traders also look for “divergences” between price and the RSI line. For example, if price rises while the RSI declines, this can be interpreted as an indication that a decline is likely to follow. The reverse is true for falling prices and rising RSI lines. This may be favorable to swing traders, but for day traders, divergences may be too infrequent.
Divergences can last several days—not always ideal for day traders looking for frequent opportunities: Take a look at the chart below. It’s a clean pattern, but it may be too long a setup for those looking to take advantage of daily price fluctuations.
Micro E-mini Dow (MYM) – Daily Chart – March 7 – June 2, 2022
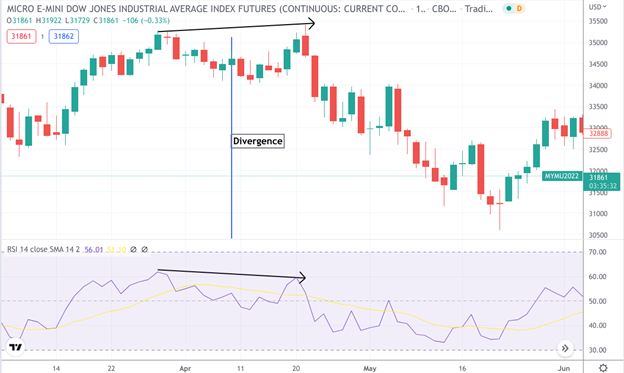
The setting for the RSI is a 14-day average. This is a good example of divergence: high go up while the relative strength reading goes down. The outcome is that the MYM falls for a period lasting around a month.
This may be ideal for a swing trader or even a position trader, but if you were looking for more frequent trading opportunities, the traditional RSI setting won’t cut it.
Hacking the RSI. So, here’s a tweak illustrated below. It may present just a few more opportunities for day traders. Also, note that it presents different tradable opportunities than the original setting.
Micro E-mini Dow (MYM) – Daily Chart – January 31 – July 7, 2022
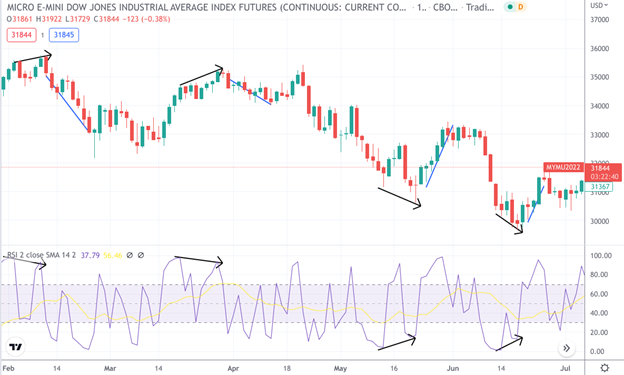
All we did was shorten the RSI length from 14 to 2. Here are a couple of things to note:
- There are more trading opportunities using this setting: not by a significant amount, but certainly more.
- If you’re a swing trader, this might have given you a week-long reversal to trade: this potentially enhances the RSI by presenting swing traders with more tradable events.
- If you’re trading ultra-short term, likely using the 5-minute chart, these reading might have given you a strong one-day trend to ride. For example, let’s zoom into the last divergence which flashed a potential buying opportunity on June 20, 2022 (for a modest 468-point swing).
Micro E-mini Dow (MYM) – Daily Chart – June 20 – 21, 2022
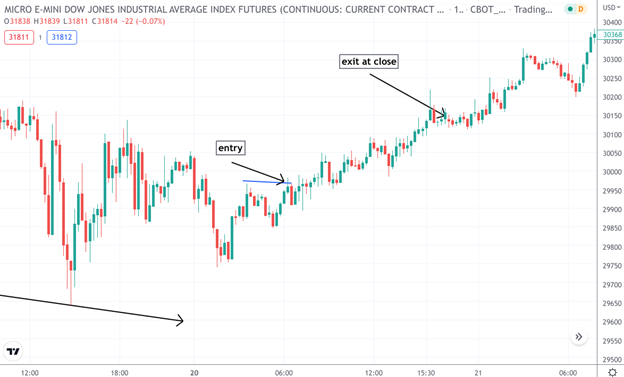
What this hack gives you is flexibility. It helps identify day-long reversals but it also presents opportunities to trade larger price swings.
Traders are always looking for an edge in the markets; something that other traders aren’t looking at or aren’t doing. But finding an “edge” doesn’t always comprise a complex approach. It can be simple, like tweaking an approach, indicator, or interpretation. And of course, no technical edge guarantees success, but instead aims to place the odds in your favor under the right circumstances.
Changing the RSI from 14 to 2 is a simple tweak. But it also potentially enhances the purpose of an RSI reading, at least for short-term traders. This hack is simply a tool that you can use when analyzing the markets. Give it a try and see when it might be useful in your own trading approach.
Please be aware that the content of this blog is based upon the opinions and research of GFF Brokers and its staff and should not be treated as trade recommendations. There is a substantial risk of loss in trading futures, options and forex. Past performance is not necessarily indicative of future results.
Disclaimer Regarding Hypothetical Performance Results: HYPOTHETICAL PERFORMANCE RESULTS HAVE MANY INHERENT LIMITATIONS, SOME OF WHICH ARE DESCRIBED BELOW. NO REPRESENTATION IS BEING MADE THAT ANY ACCOUNT WILL OR IS LIKELY TO ACHIEVE PROFITS OR LOSSES SIMILAR TO THOSE SHOWN. IN FACT, THERE ARE FREQUENTLY SHARP DIFFERENCES BETWEEN HYPOTHETICAL PERFORMANCE RESULTS AND THE ACTUAL RESULTS SUBSEQUENTLY ACHIEVED BY ANY PARTICULAR TRADING PROGRAM.
ONE OF THE LIMITATIONS OF HYPOTHETICAL PERFORMANCE RESULTS IS THAT THEY ARE GENERALLY PREPARED WITH THE BENEFIT OF HINDSIGHT. IN ADDITION, HYPOTHETICAL TRADING DOES NOT INVOLVE FINANCIAL RISK, AND NO HYPOTHETICAL TRADING RECORD CAN COMPLETELY ACCOUNT FOR THE IMPACT OF FINANCIAL RISK IN ACTUAL TRADING. FOR EXAMPLE, THE ABILITY TO WITHSTAND LOSSES OR TO ADHERE TO A PARTICULAR TRADING PROGRAM IN SPITE OF TRADING LOSSES ARE MATERIAL POINTS WHICH CAN ALSO ADVERSELY AFFECT ACTUAL TRADING RESULTS. THERE ARE NUMEROUS OTHER FACTORS RELATED TO THE MARKETS IN GENERAL OR TO THE IMPLEMENTATION OF ANY SPECIFIC TRADING PROGRAM WHICH CANNOT BE FULLY ACCOUNTED FOR IN THE PREPARATION OF HYPOTHETICAL PERFORMANCE RESULTS AND ALL OF WHICH CAN ADVERSELY AFFECT ACTUAL TRADING RESULTS.