Most traders are familiar with Fibonacci retracements and extensions. They’re commonly used, fairly easy to plot, and relatively intuitive to follow. Yet, they’re only one among a larger set of Fib tools you can use to analyze the market.
Although most trading platforms do include Fibonacci Time Zones among their indicators, many traders don’t know how to use them. Those who do use them regularly find them nearly as helpful as Fib retracements, but not as easy to interpret. So, here’s a quick intro on how to use Fib Time Zones in your trading.
What are Fibonacci Time Zones?
Fibonacci Time Zones are essentially based on a sequence of numbers where each successive number is the sum of the previous two numbers. The sequence starts with 0, 1, 2, 3, 5, 8, 13, 21, 34, 55, 89, etc. and so on. It is a technical analysis tool, which tells us when the next swing high or swing low or reversal might occur on the chart.
Fibonacci Time Zones are plotted by marking the initial swing high and swing low and then the vertical lines are drawn to the right of the chart indicating when the next swing high, swing low or reversal might occur on the chart. The swing high, low or reversal can be a minor one or a significant one.
Observe figure 1.1 of S&P 500 E Mini Futures, note after the selection of the initial swing low & swing high i.e. from period 0 to 1, how Fibonacci time zone for period 3, 8 & 13 confirmed the significant highs & lows circled in orange. The bull rally that started in April 2021 finally halted in late December at the Fibonacci time zone & the bear rally that started in early January 2022 halted in mid-June 2022.
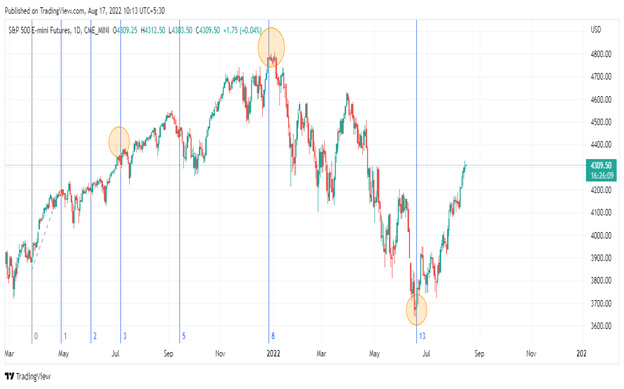
Figure 1.1 – Daily Chart of S&P 500 E Mini Futures from period March 2021 – August 2022
In Figure 1.2 Note, the Fibonacci time zone for period 5, 8, 13 & 21 confirmed the significant highs & lows circled in orange.
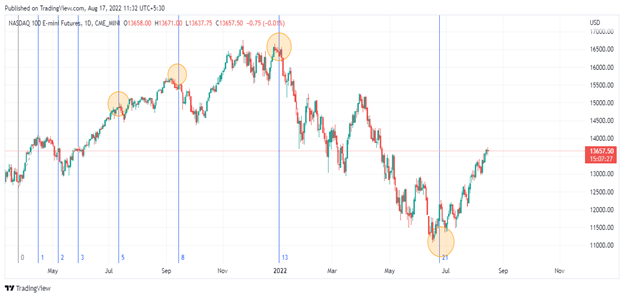
Figure 1.2 Daily Chart of Nasdaq 100 E Mini Futures from period March 2021 – August 2022
In Figure 1.3 Note, the prices adhering to the Fibonacci time zone on an hourly chart of Nasdaq 100 E Mini Futures.
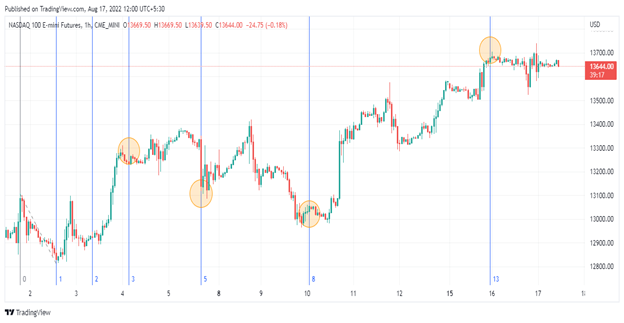
Figure 1.2 Hourly Chart of Nasdaq 100 E Mini Futures from period 2nd August 2022 – 17th August 2022
Here’s the caveat: Fibonacci time zones may not always indicate the exact reversal point or Swing highs & lows.
Sometimes the swing high, low or reversal can be observed just prior to or after the time zone. Fibonacci time zones are time-base areas, which one needs to be aware of. “Something” is likely to happen “at” or “near” the time points.
Also, note that the first few zones are difficult to use because of the tight clustering so one can avoid these zones and directly start from the 5th or the 8th Zone to allow the zones to develop.
Another caveat is that Fibonacci time zones are very subjective as it depends on the user to select the initial period. This means that selecting an initial high and low on the chart is very vital, as it will determine the subsequent time zones.
If it is observed for multiple times that the price is not in line with the Fibonacci time zones then there are two possible ways in which this issue can be handled, either one has to reconsider the starting point or assume that this tool may not be applicable to the particular security or asset.
Trading Tips for Traders
- Fibonacci Time zones are applicable for all time intervals.
- Look for long opportunities on the time zone if the prior price move was in a downtrend.
- Look for a shorting opportunity on the time zone if the prior price move was in an uptrend.
- Fibonacci Time Zone can only identify areas for a reversal of a price move, but it cannot tell you about the magnitude of the price move.
- Fibonacci Time zone can also be used for trade confirmation. For example if the price is near a resistance zone and a Fibonacci time zone, then one can assume that a peak has occurred in the prices.
- Fibonacci Time zone is more reliable if it is used in conjunction with the other technical indicators and/or fundamental analysis.
The bottom line
Fibonacci Time Zones may not be as clear or accurate as Fibonacci retracements. However, they can provide you with a time context from which you can anticipate important moves. Like all indicators requiring a great deal of interpretation, learn how to use this indicator first before testing it in a live market. It takes skill and experience to know when and when not to use it.
Please be aware that the content of this blog is based upon the opinions and research of GFF Brokers and its staff and should not be treated as trade recommendations. There is a substantial risk of loss in trading futures, options and forex. Past performance is not necessarily indicative of future results.
Disclaimer Regarding Hypothetical Performance Results: HYPOTHETICAL PERFORMANCE RESULTS HAVE MANY INHERENT LIMITATIONS, SOME OF WHICH ARE DESCRIBED BELOW. NO REPRESENTATION IS BEING MADE THAT ANY ACCOUNT WILL OR IS LIKELY TO ACHIEVE PROFITS OR LOSSES SIMILAR TO THOSE SHOWN. IN FACT, THERE ARE FREQUENTLY SHARP DIFFERENCES BETWEEN HYPOTHETICAL PERFORMANCE RESULTS AND THE ACTUAL RESULTS SUBSEQUENTLY ACHIEVED BY ANY PARTICULAR TRADING PROGRAM.
ONE OF THE LIMITATIONS OF HYPOTHETICAL PERFORMANCE RESULTS IS THAT THEY ARE GENERALLY PREPARED WITH THE BENEFIT OF HINDSIGHT. IN ADDITION, HYPOTHETICAL TRADING DOES NOT INVOLVE FINANCIAL RISK, AND NO HYPOTHETICAL TRADING RECORD CAN COMPLETELY ACCOUNT FOR THE IMPACT OF FINANCIAL RISK IN ACTUAL TRADING. FOR EXAMPLE, THE ABILITY TO WITHSTAND LOSSES OR TO ADHERE TO A PARTICULAR TRADING PROGRAM IN SPITE OF TRADING LOSSES ARE MATERIAL POINTS WHICH CAN ALSO ADVERSELY AFFECT ACTUAL TRADING RESULTS. THERE ARE NUMEROUS OTHER FACTORS RELATED TO THE MARKETS IN GENERAL OR TO THE IMPLEMENTATION OF ANY SPECIFIC TRADING PROGRAM WHICH CANNOT BE FULLY ACCOUNTED FOR IN THE PREPARATION OF HYPOTHETICAL PERFORMANCE RESULTS AND ALL OF WHICH CAN ADVERSELY AFFECT ACTUAL TRADING RESULTS.