What’s going on with crude (CLN18) fundamentally?
On June 6, Wednesday, crude oil fundamentals remain bearish as the EIA inventory report showed a supply buildup across the board. Crude slid down to 64.28. However, it failed to take out the previous day’s swing low of 64.22.
Considering that the most recent consolidation levels mark a pause from crude’s decline from its May 22 highs, crude oil’s price action makes us wonder if traders may have somehow overpriced the “downside,” a situation that reverses the risk to the “upside” for those who are short the commodity.
On June 7, news broke that OPEC will be focusing on “balancing” crude output rather than lifting caps on production. Meanwhile, Venezuela has fallen a month behind in delivering crude to its customers. Both of these developments can be considered bullish catalysts.
The technical picture, however, shows a clearer picture.
Viewing crude oil from a larger time frame, the picture looks much simpler:
Crude Oil Daily Chart: June 22, 2017 – June 7, 2018
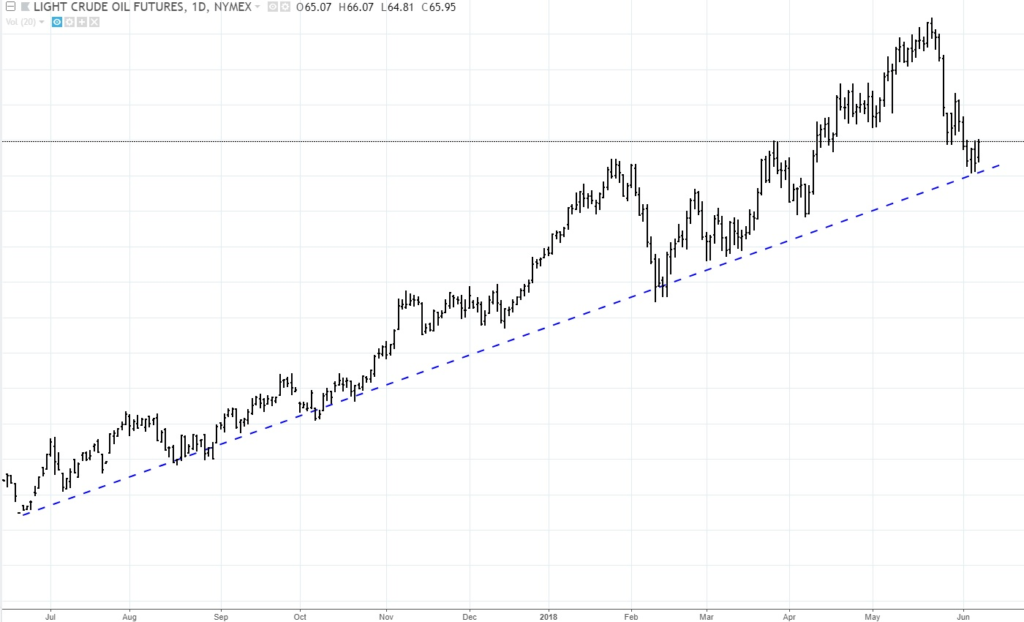
Crude oil is clearly in the midst of a “technical” uptrend; current price bouncing off the trend line. Let’s take this upward bias and look at the potential opportunities they might present.
Tactical Upside Scenario:
Crude Oil Daily Chart: August 3, 2018 – June 7, 2018
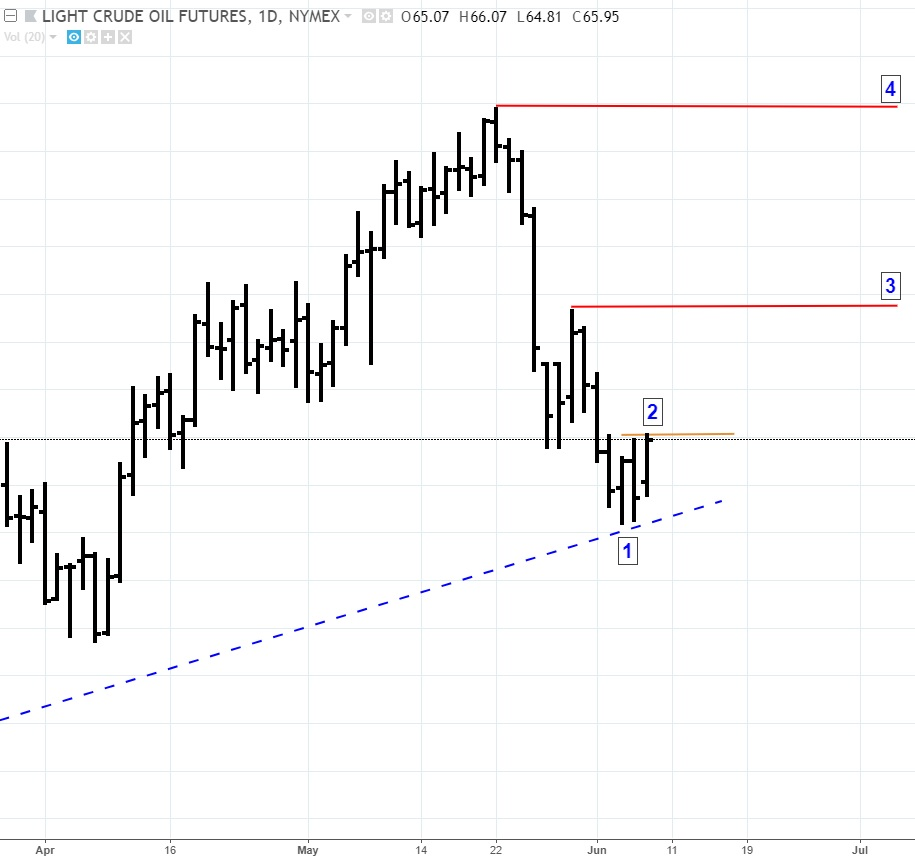
The June 5 low of 64.22 marks the most recent swing-low point (1) of which a break below would out the long-term uptrend into question.
Let’s take the uptrend scenario and assume that crude prices are about to continue on an upward trajectory having recovered from a short-term correction.
A tactical entry point would be above the high of the most recent swing-low point, preferably a session that closed lower than its open, such as the June 6 high, placing the entry point (2) at 66.00.
If the swing-low at (1) serves as both a support level and a critical market in favor of the uptrend, then it would make sense for a trader entering at 65.96 or 66.00 to place a stop around the 64.20 level.
If a trader were looking for a short-term swing opportunity, then the nearest swing high (3) at 68.70 might serve as a reasonable exit point, as swing highs tend to serve as resistance points.
For a longer-term target, and should price break above 68.70, the second swing-high/resistance level (4) at 73.00 might serve as a second target.
Note that price must break above this level in order for its long-term uptrend to continue. Should crude fail to break above this level, then this particular price action model indicates a period of ranging movement or even a possible trend reversal.
Now let’s take a look at the same chart but with a downward bias.
Tactical Downside Scenario:
If you were to take a downward bias to the markets, then you would have missed a reasonable trade. See the chart below.
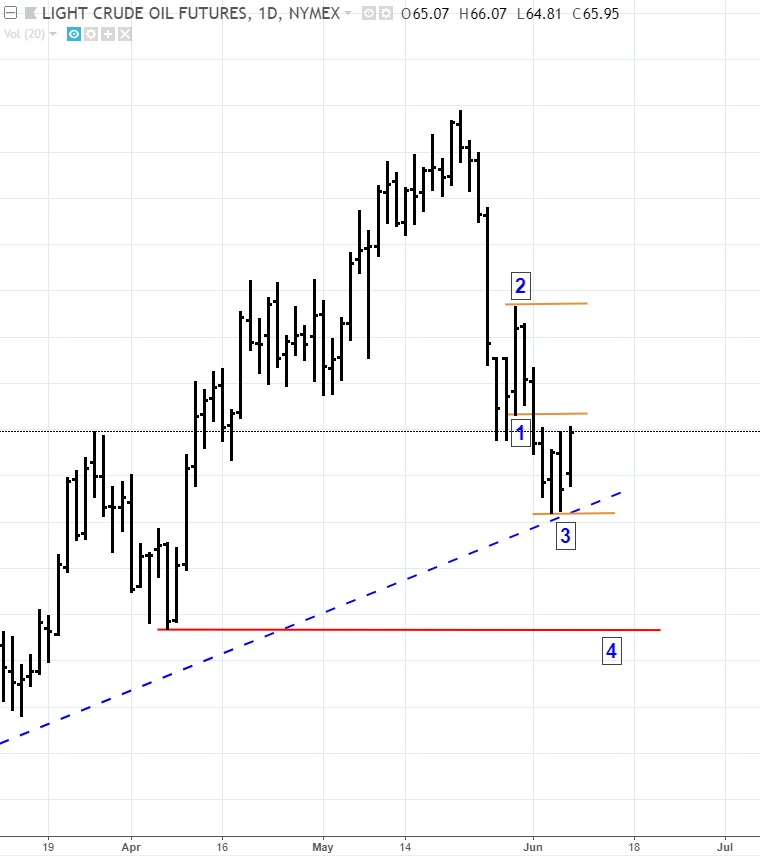
The May 30 high marked a swing-high which, from a downside perspective would have served as a “correction.” The following day confirms this, as price failed to break above the previous day’s high, ending lower.
An aggressive technical entry point would have been at (1), the low of May 30, at the price point of 66.30. A stop would have been placed at that day’s high point of 68.70 shown at (2).
If you’re wondering why at (2), it’s because the May 30 high would have been the closest resistance level before the May 22 high near 73.00. If price broke above (2), and if you were after a short-term “swing” trade, there would be no “technical” (not fundamental…but technical) basis to remain short. You would either have been stopped out, or you would have had to readjust your entry if you still interpreted the price action to signal a move lower.
Your first target would have been the supporting uptrend line (3) which as of June 6, would have already been hit. Your second target would have been the nearest support point (4) which is the April 22 swing low near 61.70.
Having missed this last entry, the next entry at the time of this writing is unclear. Crude prices moved up on June 7 signaling either an uptrend continuation or the formation of a downtrend “correction,” technically speaking.
Bear in mind that fundamentals are currently driving this market given all of the geopolitical developments affecting the industry. So pay attention to the fundamentals before deciding to follow any technical bias.
Please be aware that the content of this blog is based upon the opinions and research of GFF Brokers and its staff and should not be treated as trade recommendations. There is a substantial risk of loss in trading futures, options and forex. Past performance is not necessarily indicative of future results.