Perhaps you are a day trader or swing trader. You’ve honed your own personal approach to trading short-term momentum. Maybe long-term fundamentals play little role in your short-term “technical” outlook. You seek volatility, as it often brings just enough momentum to place a trade.
That’s all fine. After all, many traders believe it is just the setup that counts–identifying and executing it. And so you spend a good portion of time waiting for that setup.
Here’s a question: Is there a more efficient way to “forecast” the possibility of a large move without having to read through and analyze loads of fundamental reports?
In the gold and silver trading world, there is an “old school” method that is worth at least knowing about: the gold-to-silver ratio.
The gold-to-silver ratio (or gold/silver price ratio) is simply the price of gold divided by the price of silver. At the time of writing, the ratio is at 79.69. This means that one ounce of gold is equivalent to almost 80 ounces of silver.
The critical question: is the current gold/silver price ratio high? And if it is high, what might happen when the ratio declines?
Here’s a traditional interpretation of gold/silver ratio price action:
- When gold outpaces silver, this typically means that silver might be in an “undervalued” range and that more people are buying gold than silver. The reverse situation indicates that more people are buying silver than gold.
BUT, there are more sophisticated way to look at this data
- Ratio widens: when gold outpaces silver, typically the prices for both metals are falling, yet investors are flocking to gold for safety.
- Ratio recedes: when silver outpaces gold, the prices for both metals tend to rise.
Know the number 47:1 – the average ratio of gold to silver in the 20th century.
This is the “average” and NOT the rule. So let’s investigate how this ratio has played out over the last few years, as we’ve had three “swings” from top to bottom.
What happened when the ratios topped or bottomed? What happened to gold and silver prices?
The chart below (source: Valuewalk) illustrates the gold/silver ratio tops and bottoms from 2010 to the present, 2018.
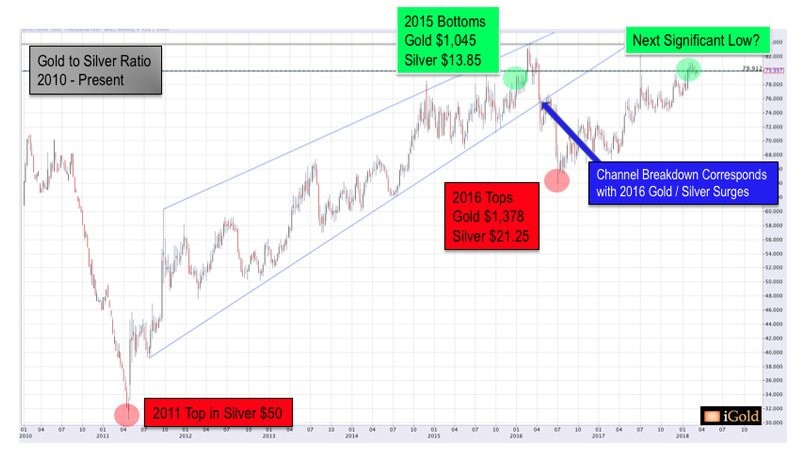
Here’s what had happened when the gold/silver price ratio hit extremes:
- 2011: Silver topped at $50 per ounce at the ratio low of 31-to-1.
- 2015: Both gold and silver bottomed ($1,045 and $13.65 respectively) as the ratio peaked at 80-to-1.
- 2016: Gold and silver ($1,378 and $21.25) topped as ratio declines to 64-to-1.
Right now, the gold/silver ratio is almost at 80:1. Might this ratio signal the possible conditions for a big move?
This is up to you, as a trader, to evaluate. Remember that ratio reading doesn’t predict directionality, but only signals the possibility of a big movement–a decline in the ratio.
And although history doesn’t always repeat itself, it would be naive to not consider history when evaluating a market.
However you trade, whatever setup you use, just be aware that if you trade silver and gold, momentum and volatility may be forthcoming.
There is a substantial risk of loss in trading futures, options and forex. Past performance is not necessarily indicative of future results.