Andrew’s Pitchfork is one of those strange indicators that seem to pop up in many contexts, from trading platforms to trading blogs, yet remains an indicator that many traders don’t know how to use.
As we’ll see below, there are a few rules to interpreting market action with Andrews’ Pitchfork, but once you get the hang of it, it’s a helpful indicator that may provide useful insight as part of your trading strategy. So, let’s get started.
What Is Andrews’ Pitchfork?
Developed by Alan Andrews, Andrews’ Pitchfork is a technical indicator that utilizes three parallel trend lines to spot possible levels of support and resistance, as well as potential levels of breakout and breakdown.
It is made by putting three points at the ends of previous trends and then drawing a line from the first point through the midpoints of the other two.
Outside trend lines, like normal trend lines and channels, indicate potential support and resistance areas.
If the Pitchfork channel holds, the trend continues; reversals occur when prices break out of the Pitchfork channel.
Andrews’ Pitchfork could be used to draw price channels
While two lines surrounding the price are usually adequate for drawing the channel, the pitchfork has an additional line that functions as the median line.
Because the median line is pivotal to the current trading method, Andrews’ Pitchfork is also known as the median line method.
This trading method is useful for determining supply and demand areas, price channels or ranges, breakout, and fadeout points, and overbought and oversold levels on any financial assets.
There are two kinds of pitchforks: bullish and bearish: A bullish template is one in which the entire pattern is rising, whereas a bearish template is one in which the entire pattern is falling. Traders can simply open their positions based on these channel types.
Parts of the pitchfork
- The Handle (start of the A to the median line )
- The resistance line (upper or lower boundary)
- The medial line (central line of a pitchfork)
- Trending in support (upper or lower boundary )
Pitchfork drawing instructions:
- Select points A, B, and C in the price action of a financial asset. Connect A and the control limits of B and C to form the median line.
- For bullish price action or a channel, “A” represents the major low, “B” represents the higher low, and “C” represents the channel low.
- In a bearish scenario, “A” will be the major high, “B” will be the next low, and “C” will be the channel high.
How to trade with Andrews’ Pitchfork
In this section, we will discuss the pitchfork validity and trading strategy based on this indicator.
Signal from the pitchfork:
- Using the pitchfork automatic indicator, draw a channel (bullish or bearish) on the trading view.
- Wait for the price to test the median line (upper or lower) and enter the trade.
- Exit the trade just below the upper or lower median line level.
Note the lows and highs:
We can assign our entry and target points based on the levels of support and resistance. In a bullish scenario, the lower line of the pitchfork represents demand, while the upper line represents supply, and vice versa in a bearish scenario.
Supplemental confirmation indicators:
For more accurate results, try using different oscillators/indicators with the above setups.
For better results, we can use indicators such as Stochastic RSI (5, 3), Super trend, and 4EMAs (50,100,150,200). Simple RSI and MACD can also be useful in determining when to exit a trade based on overbought and oversold conditions while taken in conjunction with the pitchfork.
Price action analysis:
When you’re going to open a scalp setup, double check the candlestick form and the possible movement of the asset on a higher time horizon before taking a short or long entry.
Stop Loss and Risk treatment:
Different concepts can be used to place a stop loss. For instance, if we only consider the pitchfork channel, we can place our stop loss just below the lower median line after a long entry.
Keep in mind that when using the pitchfork concept to place a stop loss, try to consider the supply and demand zones (trigger points) to avoid wicks confrontation.
Other methods, such as ATR and long position tool method or position sizing method, can also be used to set a stop loss.
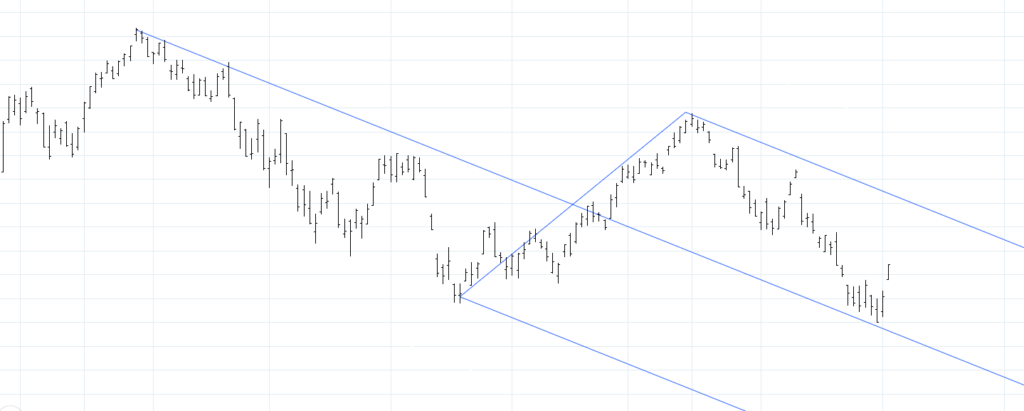
Bearish Setup (example below)
The pitchfork contextualizes the price action at the moment of entry following the trigger point. A pitchfork angling down represents a bearish setup. Depending on your strategy, you can use these pitchfork lines to gauge the strength of the instrument’s directional momentum.
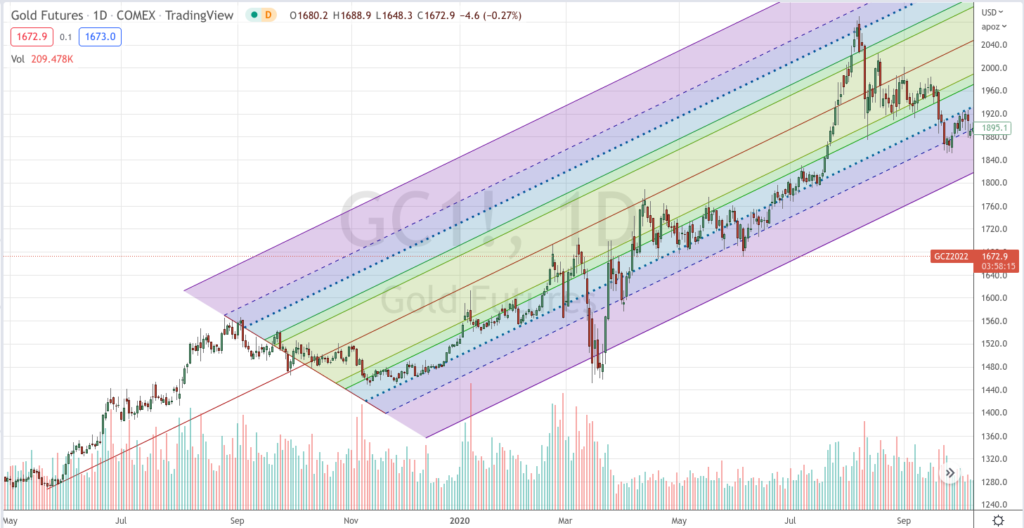
Bullish Setup (example below)
In contrast to the example above, a pitchfork angling up represents a bullish setup. Notice how the instrument followed the pitchfork’s upward channel. The point at which it fell blow the lowest lone is where the bullish directional bias would no longer have been valid.
The bottom line
Like many indicators, Andrews’ Pitchfork gives a spatio-visual context to price fluctuations. There are many different indicators you can use to provide context for your trade; each one coming with its own sets of rules as to when a trend is or is no longer valid. Sometimes, you may have to combine indicators to better determine an instrument’s probable direction.
Like all indicators, Andrews’ Pitchfork is not infallible. But again, traders don’t look for guaranteed outcomes, just a better context to find favorable trades. If you’re not familiar with this indicator, try it on a demo before using it in the live market.
Please be aware that the content of this blog is based upon the opinions and research of GFF Brokers and its staff and should not be treated as trade recommendations. There is a substantial risk of loss in trading futures, options and forex. Past performance is not necessarily indicative of future results.
Disclaimer Regarding Hypothetical Performance Results: HYPOTHETICAL PERFORMANCE RESULTS HAVE MANY INHERENT LIMITATIONS, SOME OF WHICH ARE DESCRIBED BELOW. NO REPRESENTATION IS BEING MADE THAT ANY ACCOUNT WILL OR IS LIKELY TO ACHIEVE PROFITS OR LOSSES SIMILAR TO THOSE SHOWN. IN FACT, THERE ARE FREQUENTLY SHARP DIFFERENCES BETWEEN HYPOTHETICAL PERFORMANCE RESULTS AND THE ACTUAL RESULTS SUBSEQUENTLY ACHIEVED BY ANY PARTICULAR TRADING PROGRAM.
ONE OF THE LIMITATIONS OF HYPOTHETICAL PERFORMANCE RESULTS IS THAT THEY ARE GENERALLY PREPARED WITH THE BENEFIT OF HINDSIGHT. IN ADDITION, HYPOTHETICAL TRADING DOES NOT INVOLVE FINANCIAL RISK, AND NO HYPOTHETICAL TRADING RECORD CAN COMPLETELY ACCOUNT FOR THE IMPACT OF FINANCIAL RISK IN ACTUAL TRADING. FOR EXAMPLE, THE ABILITY TO WITHSTAND LOSSES OR TO ADHERE TO A PARTICULAR TRADING PROGRAM IN SPITE OF TRADING LOSSES ARE MATERIAL POINTS WHICH CAN ALSO ADVERSELY AFFECT ACTUAL TRADING RESULTS. THERE ARE NUMEROUS OTHER FACTORS RELATED TO THE MARKETS IN GENERAL OR TO THE IMPLEMENTATION OF ANY SPECIFIC TRADING PROGRAM WHICH CANNOT BE FULLY ACCOUNTED FOR IN THE PREPARATION OF HYPOTHETICAL PERFORMANCE RESULTS AND ALL OF WHICH CAN ADVERSELY AFFECT ACTUAL TRADING RESULTS.