Prices moved, but are there more buyers or sellers?
When the price of an asset moves, the volume of buying or selling driving it may vary. Certainly, it helps to know if buying or selling volume is beginning to fade or whether it’s intensifying. This is called “buying/selling pressure.” How much “pressure” is behind the price fluctuation?
One indicator that’s designed to help answer this question is the Accumulation Distribution Indicator, developed by Marc Chaikin.
The Accumulation Distribution Indicator (AD) is a volume-based indicator that tries to display an asset’s buying and selling pressure. In other words, it attempts to measure the cumulative flow of money into and out of an asset.
When anticipating the strength of a price’s trajectory, it may help a lot to see if there’s enough “tailwind” to sustain it.
Three steps to calculating the AD
- First, the “money flow multiplier” is calculated, which is a measure of the close compared to the trading range.
- Second, the multiplier’s value is multiplied by today’s volume to arrive at the current period’s money flow volume.
- Third, today’s AD is calculated by adding the current money flow volume to the previous AD value.
The Multiplier value will always range from +1 to -1.
When the close is above the mid-range, the multiplier will be positive resulting in an increase in the AD line.
Likewise, when the close is below the mid-range the multiplier will be negative resulting in a decrease in the AD line.
The AD line remains unchanged if the close is at the mid-range.
In Figure A below, compare the individual candlestick price action with the corresponding AD Line.
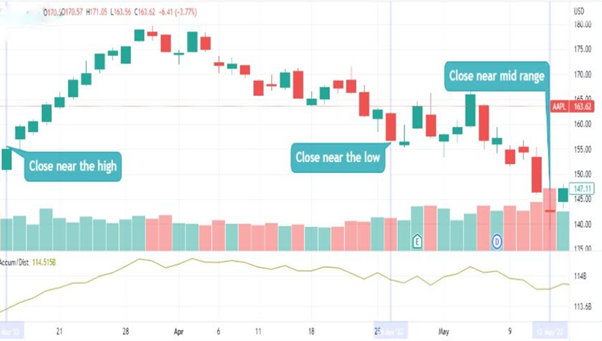
Figure A Daily chart of XYZ (hypothetical asset)
The AD line is used to confirm price trends and reversals.
If the prices are in an uptrend but the AD line is in a downtrend then it tells us that there is not enough buying pressure to sustain the move. Prices may reverse to the downside.
The opposite is true in the reverse scenario.
In Figure B below, observe points 1-9 and note the AD line along with the price action.
- Prices break through the Broadening pattern with a long green candle, which is also a bullish piercing pattern; one can initiate a buy entry on the next day with a stop loss below the low of the green candle.
- The uptrend line is broken by the AD line and buy entry is closed and a sell entry is initiated on the next day. The sell entry gets extra confirmation from the falling window & a stop loss to be placed just above the falling window.
- Prices continue downward until the downtrend of the AD line is broken and notice that a bullish engulfing pattern is formed indicating that the bears lost control and the bulls are in action. An exit is done from the short entry and buy entry is initiated on the next day.
- Rising window confirms the uptrend and the prices rise sharply. A sharp rise in prices followed by the steep AD line makes sense, as buying pressure is required to sustain the uptrend.
- The uptrend line is broken & the bears take charge. The prices are in a downtrend, but are very volatile, confirmed by the moderate slope in the AD line.
- The downtrend line is broken and the trend changes to sideways confirmed by the rectangle pattern in the AD line.
- The prices break down through the rectangle pattern and the downturn
- Finally, the downtrend ends and the prices march north only to stop near the highs made in early April forming a double top.
- The uptrend line is broken indicating a change in trend.
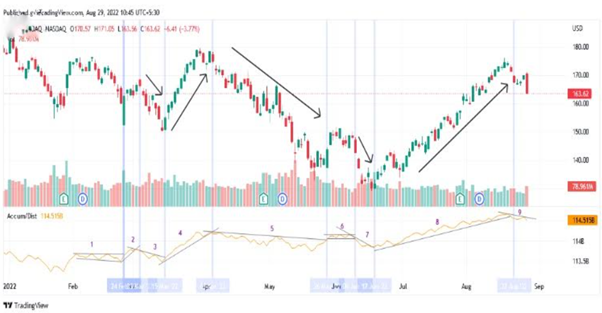
Figure B Daily chart of XYZ
By combining the western technical analysis along with Japanese candlestick charting techniques, the AD line could be used to capture a trend successfully. In Figure B, at points 4, 5 & 8 one would have been able to take advantage of the uptrend & downtrend.
Caveat: There is an important limitation associated with the AD line: The AD line does not consider gaps as it compares the close with the current trading range. On days when the prices gap up & the close on the next day is below the mid-range of the trading range, the AD line will decrease, even if the prices increase on that day. So, watch out for this situation.
The bottom line
Note that the AD is NOT a standalone indicator. You should use it in conjunction with other indicators or patterns. But if you are able to combine with your indicators or patterns of choice, it can give you a unique snapshot of the buying/selling pressure that may be driving an asset’s price move. And a view from this particular angle is something that many other indicators can’t provide.
Please be aware that the content of this blog is based upon the opinions and research of GFF Brokers and its staff and should not be treated as trade recommendations. There is a substantial risk of loss in trading futures, options and forex. Past performance is not necessarily indicative of future results.
Disclaimer Regarding Hypothetical Performance Results: HYPOTHETICAL PERFORMANCE RESULTS HAVE MANY INHERENT LIMITATIONS, SOME OF WHICH ARE DESCRIBED BELOW. NO REPRESENTATION IS BEING MADE THAT ANY ACCOUNT WILL OR IS LIKELY TO ACHIEVE PROFITS OR LOSSES SIMILAR TO THOSE SHOWN. IN FACT, THERE ARE FREQUENTLY SHARP DIFFERENCES BETWEEN HYPOTHETICAL PERFORMANCE RESULTS AND THE ACTUAL RESULTS SUBSEQUENTLY ACHIEVED BY ANY PARTICULAR TRADING PROGRAM.
ONE OF THE LIMITATIONS OF HYPOTHETICAL PERFORMANCE RESULTS IS THAT THEY ARE GENERALLY PREPARED WITH THE BENEFIT OF HINDSIGHT. IN ADDITION, HYPOTHETICAL TRADING DOES NOT INVOLVE FINANCIAL RISK, AND NO HYPOTHETICAL TRADING RECORD CAN COMPLETELY ACCOUNT FOR THE IMPACT OF FINANCIAL RISK IN ACTUAL TRADING. FOR EXAMPLE, THE ABILITY TO WITHSTAND LOSSES OR TO ADHERE TO A PARTICULAR TRADING PROGRAM IN SPITE OF TRADING LOSSES ARE MATERIAL POINTS WHICH CAN ALSO ADVERSELY AFFECT ACTUAL TRADING RESULTS. THERE ARE NUMEROUS OTHER FACTORS RELATED TO THE MARKETS IN GENERAL OR TO THE IMPLEMENTATION OF ANY SPECIFIC TRADING PROGRAM WHICH CANNOT BE FULLY ACCOUNTED FOR IN THE PREPARATION OF HYPOTHETICAL PERFORMANCE RESULTS AND ALL OF WHICH CAN ADVERSELY AFFECT ACTUAL TRADING RESULTS.