There are certain major market movements that can be anticipated simply because all eyes are on the outcome. When approaching such a critical juncture, the outcome can sometimes be explosive, either moving the markets upward or downward.
Rather than focusing on trying to predict which way the market will respond, consider the importance of positioning yourself to catch a potentially high upside while trying to keep your downside risks to a minimum.
Let’s evaluate the S&P 500 on October 28, 2019 for a case study.
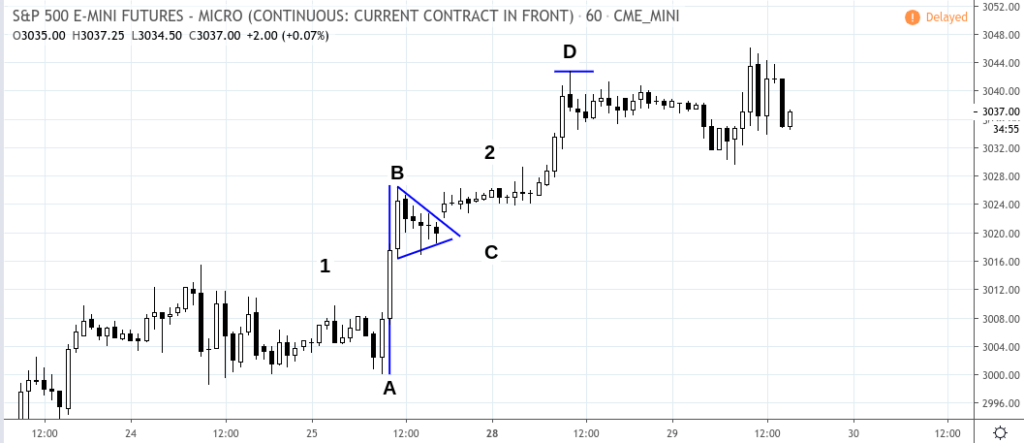
Micro Emini S&P 500 (MES) 1-Hour Chart Oct 23 to Oct 29, 2019
Note: We’re using the MES chart as many traders might have reservations about holding a futures position over the weekend due to risk and margin requirements. The MES may be more manageable with regard to both.
For months, investors have been waiting for the S&P 500 cash index to break above the 3028.00 level, given the right mix of fundamental factors. If you had been following financial media in the week of October 20, you would have seen plenty of mention of the S&P 500 potentially breaking into new highs. This was contingent on the absence of negative headline risk.
On Friday, October 25 as shown at [1], stock indexes advanced on strong Q3 earnings, led by Intel, which offset Amazon’s weak earnings numbers. In addition to this, market optimism seems to be supported by news from Washington that US trade representatives will be conversing with Chinese officials today by telephone to finalize details on the first phase of a trade deal.
Given the right conditions, particularly in light of the trade talks which appeared to be progressing, one might have anticipated the following week to be the moment when the S&P 500 may finally break into new highs. If you look at the chart above, Oct 25th shows the formation of a pennant pattern, its base at [A], its top at [B], the pennant [C] forming toward the end of the day.
One traditional approach to trading a pennant would be to measure the entire height of the pattern (A+B), and to add that number to the bottom of the pennant (or the lowest point of C). The entry point would have been at the breakout of the pennant itself, while a stop loss would be placed a few ticks below [C].
The top of the pattern would be at 3026.50; the bottom at 3000.00. A trader might have subtracted the bottom from the top to come up with the measurement of 26.50. Adding that figure to the bottom of [C] at 3016.25 would give the measured-move price target of 3042.75 as shown at [D].
Regardless of the technicals, none of the measurements would mean much without the fundamental tailwinds to support it. In the early hours of Monday, October 29, there was no major news to derail the optimism surrounding the US-China trade talks. And despite the Chicago Fed’s National Activity Index numbers coming in negative, the International Trade report showed that the deficit had slightly narrowed. More importantly, earnings were coming in strong.
Note that the market had already assumed these numbers as the S&P 500’s breakout toward new highs happened right before the market had opened at [D], which happened to be the price target for this short-term pennant trade. Had traders waited until market open, they would have missed the trade.
The truth is that nobody could have “predicted” the factors supporting this breakout. But one arguable might have “anticipated” it considering the surrounding fundamental and “technical” context. One could have identified the trade and set appropriate risk parameters, as a trade setup in the form of a pennant was visible.
In cases such as this, where you are trading in a potentially fast market, remember to always watch your positions closely.
Not all market opportunities come with clear setups. But when they do, and if they’re supported by fundamentals, then it might be worth taking the opportunity to place the trade.
Please be aware that the content of this blog is based upon the opinions and research of GFF Brokers and its staff and should not be treated as trade recommendations. There is a substantial risk of loss in trading futures, options and forex. Past performance is not necessarily indicative of future results.
Be advised that there are instances in which stop losses may not trigger. In cases where the market is illiquid–either no buyers or no sellers–or in cases of electronic disruptions, stop losses can fail. And although stop losses can be considered a risk management (loss management) strategy, their function can never be completely guaranteed.
Disclaimer Regarding Hypothetical Performance Results: HYPOTHETICAL PERFORMANCE RESULTS HAVE MANY INHERENT LIMITATIONS, SOME OF WHICH ARE DESCRIBED BELOW. NO REPRESENTATION IS BEING MADE THAT ANY ACCOUNT WILL OR IS LIKELY TO ACHIEVE PROFITS OR LOSSES SIMILAR TO THOSE SHOWN. IN FACT, THERE ARE FREQUENTLY SHARP DIFFERENCES BETWEEN HYPOTHETICAL PERFORMANCE RESULTS AND THE ACTUAL RESULTS SUBSEQUENTLY ACHIEVED BY ANY PARTICULAR TRADING PROGRAM.
ONE OF THE LIMITATIONS OF HYPOTHETICAL PERFORMANCE RESULTS IS THAT THEY ARE GENERALLY PREPARED WITH THE BENEFIT OF HINDSIGHT. IN ADDITION, HYPOTHETICAL TRADING DOES NOT INVOLVE FINANCIAL RISK, AND NO HYPOTHETICAL TRADING RECORD CAN COMPLETELY ACCOUNT FOR THE IMPACT OF FINANCIAL RISK IN ACTUAL TRADING. FOR EXAMPLE, THE ABILITY TO WITHSTAND LOSSES OR TO ADHERE TO A PARTICULAR TRADING PROGRAM IN SPITE OF TRADING LOSSES ARE MATERIAL POINTS WHICH CAN ALSO ADVERSELY AFFECT ACTUAL TRADING RESULTS. THERE ARE NUMEROUS OTHER FACTORS RELATED TO THE MARKETS IN GENERAL OR TO THE IMPLEMENTATION OF ANY SPECIFIC TRADING PROGRAM WHICH CANNOT BE FULLY ACCOUNTED FOR IN THE PREPARATION OF HYPOTHETICAL PERFORMANCE RESULTS AND ALL OF WHICH CAN ADVERSELY AFFECT ACTUAL TRADING RESULTS.