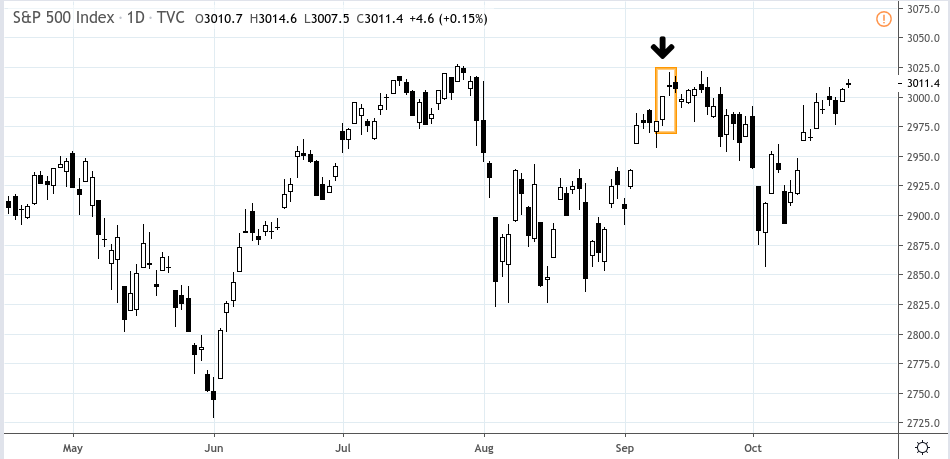
S&P 500 Index – Daily Chart – April 15, 2019 to October 22, 2019
Take a look at the two days in the orange box. It might not look like much from a big picture perspective but both days–September 11 and 12–were rocked by a tumultuous sequence of events that prevented the S&P 500 from reaching a record high that month, as most investors had expected.
Looking back, these events illustrate how “headline risk” and sudden shifts in market sentiment can overpower longer-term expectations. They also warn us to stay on top of the fundamental environment, so that we may distinguish between sentiment-driven volatility and fluctuations driven by economic factors that may have a longer-term impact on the markets.
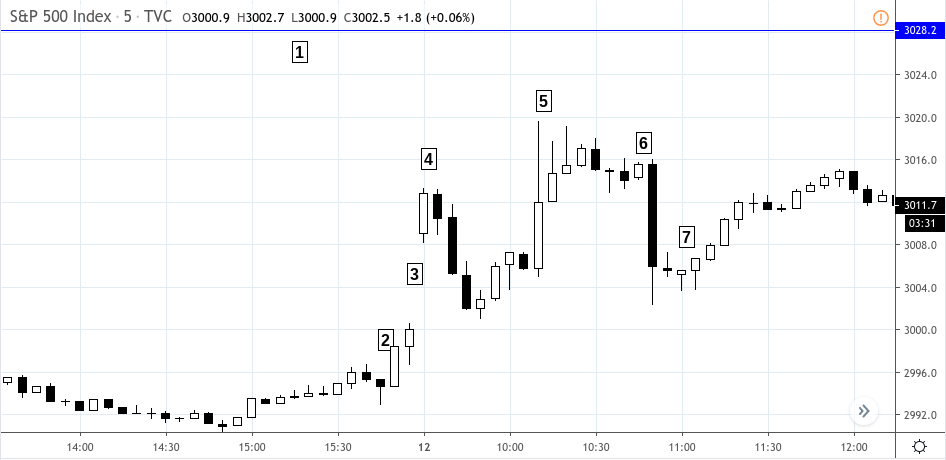
S&P 500 Index – 5-Minute Chart – September 11, to September 12, 2019
On Wednesday, September 11, the S&P 500 was trading several points below its last all-time-high of 3028 [1]. Investors were expecting the index to break above it, taking the S&P 500 into new record-high territory.
That evening, news that the Oval Office had delayed a planned tariff increase on Chinese goods as a “gesture of goodwill” arguably sent index futures soaring as shown at [2]. The tariffs were set to increase from 25% to 30% in 15 days which would have targeted $250 billion worth of Chinese imports. The announcement on this delay arguably boosted optimism in the market.
Early Thursday morning [3], on September 12, the ECB announced its plans to cut deposit rates by 10 basis points–bringing it down to -0.5%. The ECB would embark on a bond-buying program worth 20 billion Euros per month. Investors saw this as a positive move, hoping that an increased level of quantitative easing (QE) in Europe might help rev-up the global economy.
Before the US stock market opened, the Consumer Price Index–which measures inflation–came out with mixed numbers [4]. Inflation in August rose slightly, which was good news for those expecting a Fed rate cut the following week. Consumer prices also slowed in the previous month, according to a Labor Department report. This could be interpreted to mean that inflation was relatively tame. However, the “core” CPI measurement rose 2.4% year over year. This marked the highest level since 2008.
Stocks continued trading higher on news that the White House may be considering an interim deal with China [5]. But minutes later, a White House administration official announced that the US is “absolutely not” considering an interim deal to delay the planned tariffs, and that likely sent stocks sliding [6].
But investor sentiment shifted again [7], as investors were optimistic about Apple and Amazon reporting fiscal quarter earnings. Both tech giants’ earnings exceeded consensus expectations, allowing the broader market to recover.
The Bottom Line – Volatility, Market Noise, and Headline Risk
Perhaps there was a way to have “technically” traded this market. After all, support levels seemed to have held and the range might have indicated a reasonable sideways trading environment. But we can only say this in retrospect.
If the tariff announcements were not mixed, then the direction might have been clearer. Had investors not expected Apple or Amazon to beat expectations, then there might not have been fewer tailwinds to support the market’s recovery.
It just shows that when you trade in an environment that is vulnerable to headline risk, it helps to stay on top of fundamental developments. Overall, the short-term trend–and we’re referring to the daily charts–was nothing less than uncertain, with an FOMC meeting on the horizon, the ongoing trade war going one way and then another, with Q3 earnings season still to come, and “positive’ performance from sectors yielding record-high negative earnings guidance.
Remember, the fundamental environment drives business decisions, and businesses drive the markets. As short-term traders, many of us might assume that technicals absorb fundamentals, and to a degree this may be true, but only in hindsight. When it comes to anticipating potential responses to an unfolding environment, businesses arguably base no decisions off chart patterns–they make decisions based on supply and demand, customer needs, and competitor developments. So if you trade the markets, keep an eye on fundamentals. Because fundamentals, more so than any other factor, can cause the markets to trend or turn on a dime.
Please be aware that the content of this blog is based upon the opinions and research of GFF Brokers and its staff and should not be treated as trade recommendations. There is a substantial risk of loss in trading futures, options and forex. Past performance is not necessarily indicative of future results.
Disclaimer Regarding Hypothetical Performance Results: HYPOTHETICAL PERFORMANCE RESULTS HAVE MANY INHERENT LIMITATIONS, SOME OF WHICH ARE DESCRIBED BELOW. NO REPRESENTATION IS BEING MADE THAT ANY ACCOUNT WILL OR IS LIKELY TO ACHIEVE PROFITS OR LOSSES SIMILAR TO THOSE SHOWN. IN FACT, THERE ARE FREQUENTLY SHARP DIFFERENCES BETWEEN HYPOTHETICAL PERFORMANCE RESULTS AND THE ACTUAL RESULTS SUBSEQUENTLY ACHIEVED BY ANY PARTICULAR TRADING PROGRAM.
ONE OF THE LIMITATIONS OF HYPOTHETICAL PERFORMANCE RESULTS IS THAT THEY ARE GENERALLY PREPARED WITH THE BENEFIT OF HINDSIGHT. IN ADDITION, HYPOTHETICAL TRADING DOES NOT INVOLVE FINANCIAL RISK, AND NO HYPOTHETICAL TRADING RECORD CAN COMPLETELY ACCOUNT FOR THE IMPACT OF FINANCIAL RISK IN ACTUAL TRADING. FOR EXAMPLE, THE ABILITY TO WITHSTAND LOSSES OR TO ADHERE TO A PARTICULAR TRADING PROGRAM IN SPITE OF TRADING LOSSES ARE MATERIAL POINTS WHICH CAN ALSO ADVERSELY AFFECT ACTUAL TRADING RESULTS. THERE ARE NUMEROUS OTHER FACTORS RELATED TO THE MARKETS IN GENERAL OR TO THE IMPLEMENTATION OF ANY SPECIFIC TRADING PROGRAM WHICH CANNOT BE FULLY ACCOUNTED FOR IN THE PREPARATION OF HYPOTHETICAL PERFORMANCE RESULTS AND ALL OF WHICH CAN ADVERSELY AFFECT ACTUAL TRADING RESULTS.