By the time you read this, the markets will already have moved beyond the current price levels at the time of this writing.
Friday (March 8, 2019) capped off a 5-day consecutive losing streak for the Dow, S&P 500, and the Nasdaq Composite.
The question that most investors are asking at this point is whether we are heading once again into correction territory, or whether the last decline (from the most recent February 25 high) marks the first leg of a “bear market rally”?
The truth is that we won’t know until well after the fact.
We can, however, take a look at the current price action to see what kind of swing opportunities might have presented themselves. First let’s look at a few fundamental indications and what they might mean.
Recessionary Fears Re-Emerging
US indices imploded recently likely as a response to several international reports, including a report from the European Central Bank and another from China. These may be indications of a potential “synchronized” global slowdown.
Other possible indications include reports of 2018’s record-level gold purchases by central banks across the globe–a buying spree that exceeded levels seen within the last 50 years. Apparently, central banks are looking for a diversified hedge against US Treasuries, dollar weakness, and a slowing global economy.
Rounded Top or Range?
If you were to look at bear market data since 1929, you would notice that it didn’t start abruptly. In most cases, bear markets begin with a whimper: a weakening optimism that fails to transform into full-blown pessimism until the bear is well underway.
On a technical level, most bear markets begin with a rounded top pattern, a weakening sequence of rising and falling highs that reflect the weakening optimism that characterizes the onset of a bear from a level of pure sentiment.
It’s not clear whether the recent markets illustrate a rounded top or just a confused mix of patterns at various scales:
E-Mini Dow (YM continuous contract) Daily chart March 8, 2017 to March 9, 2019
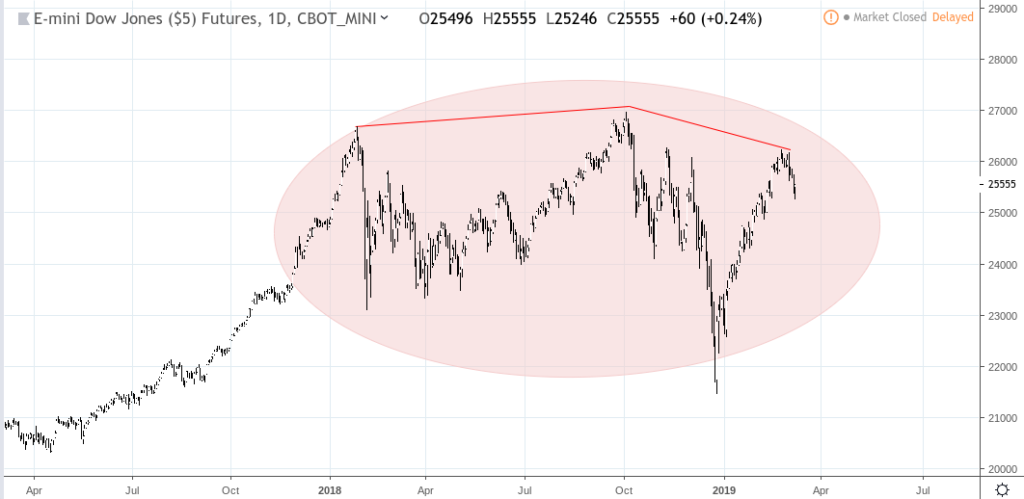
A Conflation of Conflicting Patterns on the Micro and Macro Scale
Much of the 2018 volatility was driven by a heterogeneous mix of geopolitical and economic news, from US-China trade disputes to the Fed’s shift to quantitative tightening policy. Hence the extreme volatility consisting of unclear small- to large-scale patterns.
We see a symmetrical triangle re-drawn twice, a volatile recovery transformed into a minor uptrend, a set of declines almost resembling a trading range, and a misshapen pattern of highs that resemble something between a cross between a large range, a weak head-and-shoulders, an uneven triple top, or just a rounded top with a steep decline and parabolic micro uptrend.
Streaks of contending geopolitical and economic shocks make for a confusing and ugly chart.
Swing Trading Opportunities
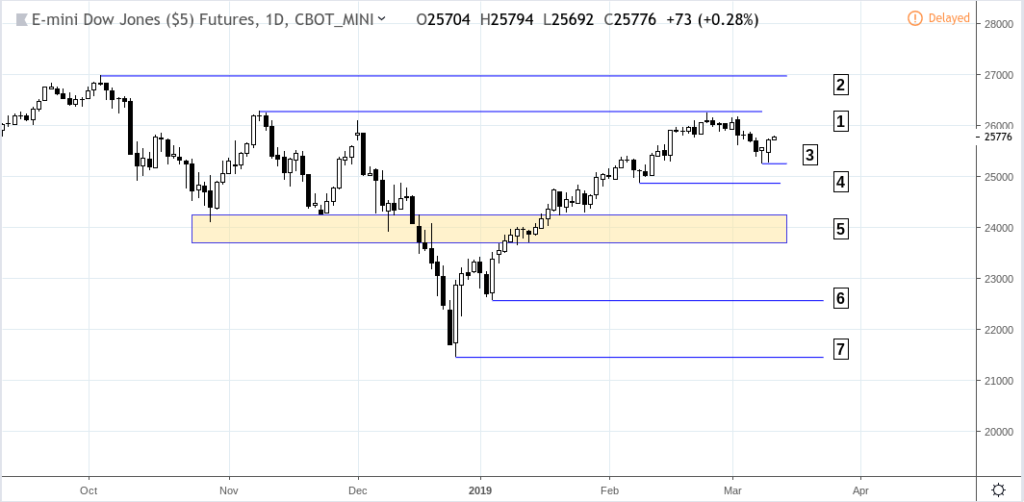
E-Mini Dow (YM continuous contract) Daily chart March 8, 2017 to March 9, 2019
This approach to swing trading is not based on prediction but principles. Predictions can be wrong, but price action principles are designed to be flexible.
Take a look at the YM chart above. If the current market is in a bull correction, then prices can still go either way, up or down prior to breaking above its all-time-high of 26966.00. Let’s assume nothing and just look at the practical setups before us.
If price breaks above the most recent swing high at (1), then the all time high at (2) can serve as an initial profit target for a long position. If you’re bullish, (2) can be a place to unload a partial position if you are anticipating a breakout above this level.
A break below the most recent swing low at (3), may lead to some kind of bounce at (4) and consolidated action at the (5) range, where three levels of support are to be found. A break below this level may experience minor support at (6) but likely to see major support at the critical level of (7), both levels serving as strong short-term profit targets for a short below (5).
And if markets are indeed in a bear rally, then you might expect another bear rally before price reaches (6). Note that on a weekly or monthly chart, (7) shows strong price rejection toward the upside. (7) also is close to the 50% Fibonacci level from the June 2015 support at 15285, making it a potentially critical technical level. So if prices reach this point, be wary of a strong response of buying or short covering.
How Fundamental Context May Help
Understanding the fundamental context may help you anticipate potential market response in light of technical levels during times of scheduled economic releases (hence the importance of following an economic calendar). It may not help you respond to sudden and unexpected market news, but knowing the context might help you make more informed decisions.
But identifying the technical setups within the fundamental context might help you identify “tactical” opportunities within a larger “strategic” perspective. There is no way to know whether the markets are in a bull correction or a bear rally. But what is known is that should either one be the case, you can tactically identify swing trading opportunities in either direction. And once you make a decision about what you believe is the general direction of the markets, you can adjust your directional bias in favor of the technical trading opportunities already within your mental radar.
Please be aware that the content of this blog is based upon the opinions and research of GFF Brokers and its staff and should not be treated as trade recommendations. There is a substantial risk of loss in trading futures, options and forex. Past performance is not necessarily indicative of future results.
Disclaimer Regarding Hypothetical Performance Results: HYPOTHETICAL PERFORMANCE RESULTS HAVE MANY INHERENT LIMITATIONS, SOME OF WHICH ARE DESCRIBED BELOW. NO REPRESENTATION IS BEING MADE THAT ANY ACCOUNT WILL OR IS LIKELY TO ACHIEVE PROFITS OR LOSSES SIMILAR TO THOSE SHOWN. IN FACT, THERE ARE FREQUENTLY SHARP DIFFERENCES BETWEEN HYPOTHETICAL PERFORMANCE RESULTS AND THE ACTUAL RESULTS SUBSEQUENTLY ACHIEVED BY ANY PARTICULAR TRADING PROGRAM.
ONE OF THE LIMITATIONS OF HYPOTHETICAL PERFORMANCE RESULTS IS THAT THEY ARE GENERALLY PREPARED WITH THE BENEFIT OF HINDSIGHT. IN ADDITION, HYPOTHETICAL TRADING DOES NOT INVOLVE FINANCIAL RISK, AND NO HYPOTHETICAL TRADING RECORD CAN COMPLETELY ACCOUNT FOR THE IMPACT OF FINANCIAL RISK IN ACTUAL TRADING. FOR EXAMPLE, THE ABILITY TO WITHSTAND LOSSES OR TO ADHERE TO A PARTICULAR TRADING PROGRAM IN SPITE OF TRADING LOSSES ARE MATERIAL POINTS WHICH CAN ALSO ADVERSELY AFFECT ACTUAL TRADING RESULTS. THERE ARE NUMEROUS OTHER FACTORS RELATED TO THE MARKETS IN GENERAL OR TO THE IMPLEMENTATION OF ANY SPECIFIC TRADING PROGRAM WHICH CANNOT BE FULLY ACCOUNTED FOR IN THE PREPARATION OF HYPOTHETICAL PERFORMANCE RESULTS AND ALL OF WHICH CAN ADVERSELY AFFECT ACTUAL TRADING RESULTS.