“V Bottoms” can be notoriously difficult to trade. You are coming off a steep and often panic-driven market selloff. Next thing you know, the market undergoes a sharp reversal to the upside. And it keeps on going, leaving you behind without a trading opportunity.
E-Mini S&P 500 (ES continuous contract view ) Daily chart – August 29, 2018 to March 4, 2019
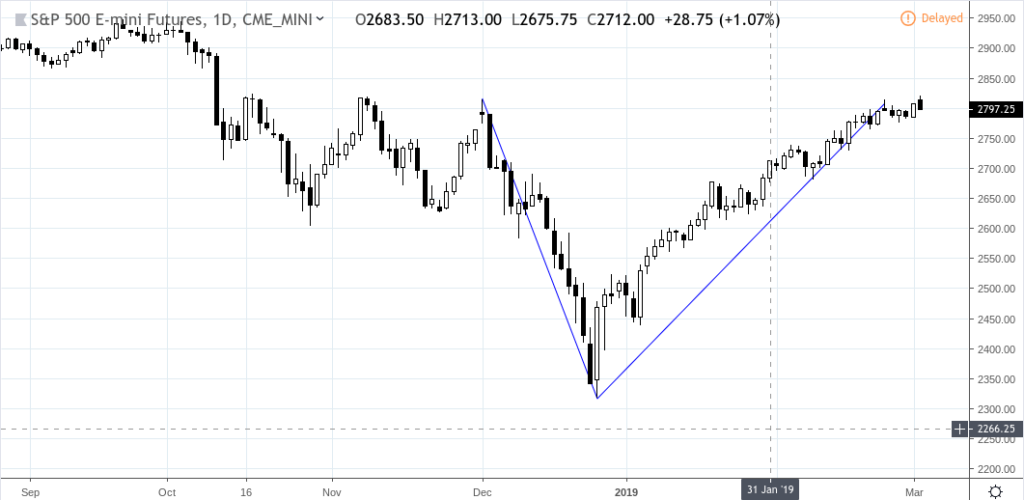
By the time you’ve confirmed that a V Bottom just took place, you may have missed your long entry point; or if you were short, you might have missed a potential exit point.
Although V Bottoms can be difficult to anticipate, they are subtle clues to watch for — clues that might make them “tradeable.”
V Bottom Trade Setups
A V Bottom trade requires two preconditions for a setup:
- A fundamental or technical “reason” for a potential bottoming.
- A micro-trend indication of a potential reversal.
Let’s take another look at the ES chart:
E-Mini S&P 500 (ES continuous contract view ) Daily chart – August 29, 2018 to March 4, 2019
A fundamental or technical “reason” for a potential bottoming:
Take a look at December 24 and 26 as shown on (1).
- On December 24, US Treasury Secretary Steven Mnuchin made a public announcement to try to calm the markets. It backfired, triggering a steep decline.
- On December 26, news that the Fed may be more sensitive to market response, possibly halting rate hikes, may have triggered one of the largest one-day surges in market history.
- On the technical front, we see minor technical support at the weekly low of March 27, 2017 around the 2317.75 level.
E-Mini S&P 500 (ES continuous contract view ) WEEKLY chart – October 31, 2016 to March 4, 2019
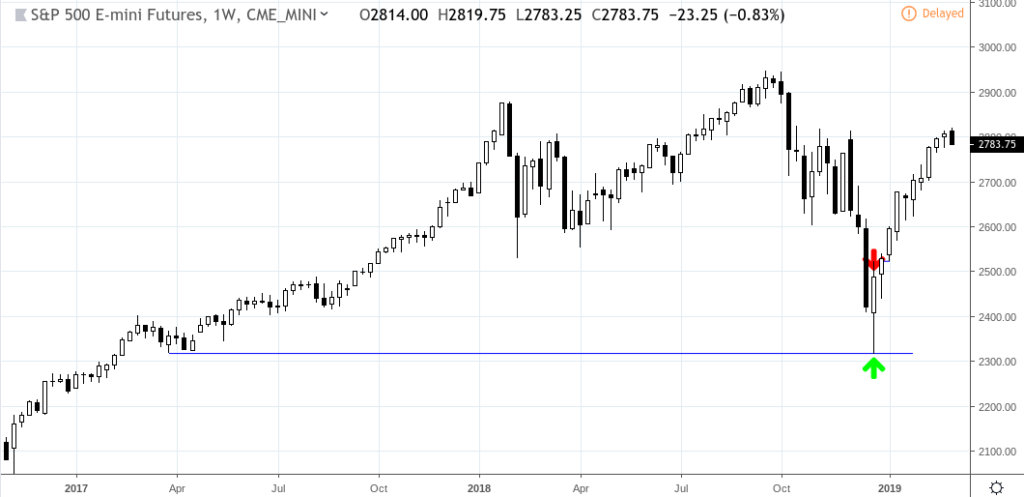
Based on these two readings–one fundamental and the other technical–we can anticipate the possibility of a low being established near 2317.75.
Both reasons may have contributed to the markets sharp rise (the fundamental reason potentially stronger than the technical).
So now that the market had potentially reversed, are there any features on the technical landscape that might give you a long entry point?
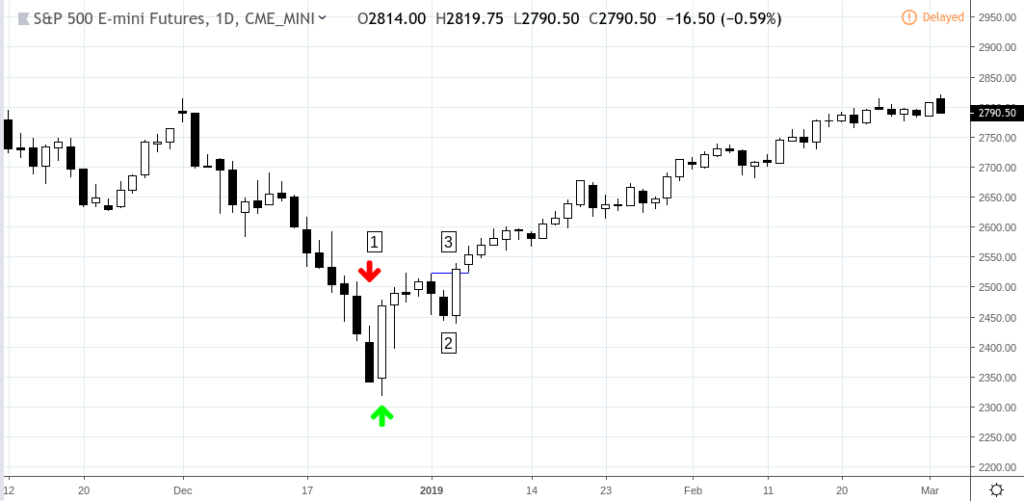
Let’s take a closer look at the daily chart:
E-Mini S&P 500 (ES continuous contract view ) Daily chart – Nov 18, 2018 to Mar 4, 2019
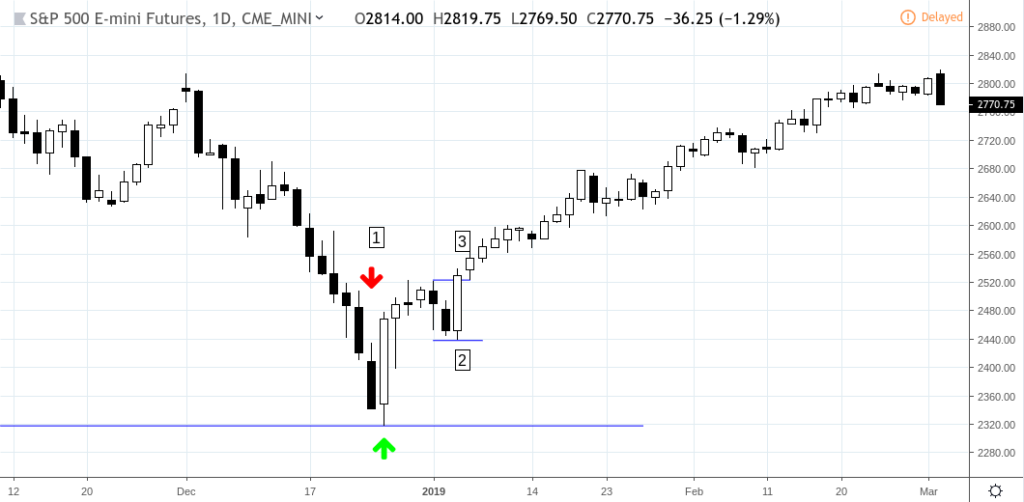
Fortunately, the immediate reversal was followed by a pull back at (2), establishing a higher swing low. A breakout of the top bar at (3) might have been a conservative long entry point with a stop loss a few ticks below the low at (2).
As far as profit targets, there were many (if you had targeted previous support and resistance levels), but the big target would have been the top peak from which the V Bottom had originated.
Bear in mind that not all V Bottoms show a pull back after its reversal.
Crude Oil (CL continuous contract view) Daily chart – Nov 18, 2018 to Mar 4, 2019
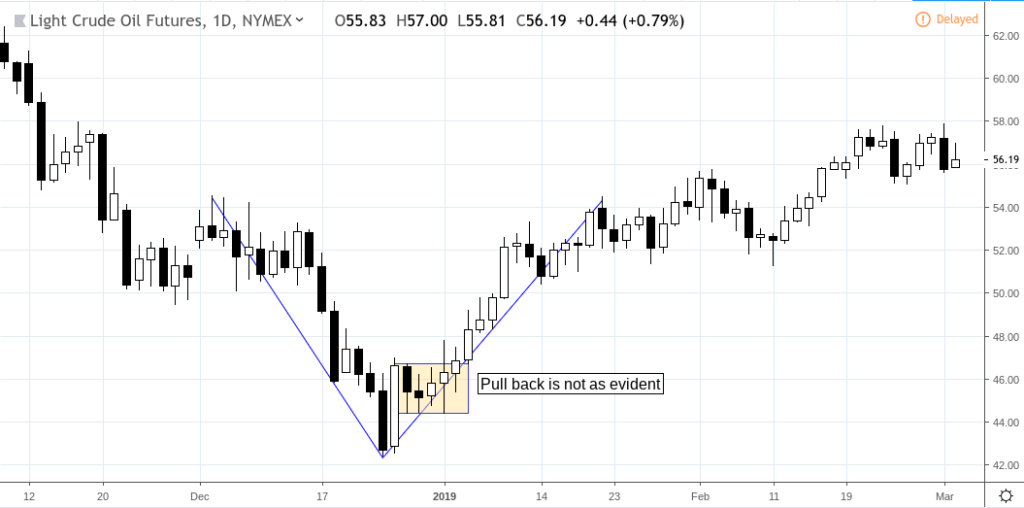
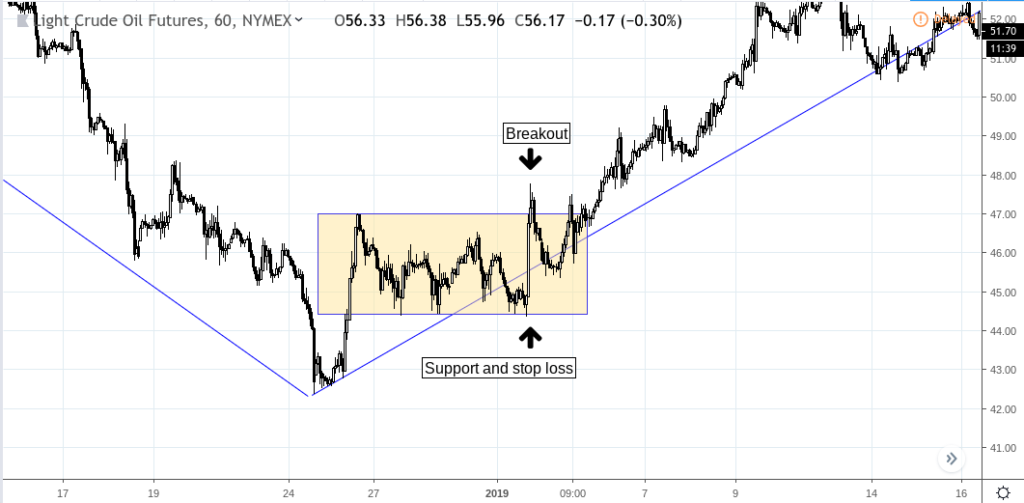
In this case, it might help to scale down to the hourly charts to find an entry point, as micro-trends are more likely to be visible on a smaller scale chart.
Crude Oil (CL continuous contract view) HOURLY chart – Dec 13, 2018 to Jan 16, 2019
To conclude, some patterns can be notoriously difficult to trade. The V Bottom is just one of them. When it comes down to identifying a trading opportunity, no matter how difficult the context, you must remember simple set of questions:
- Is there a potentially tradeable context, meaning…
- Can you identify a clear trending or non-trending market, leading to…
- Can you identify a breakout level for an entry point and support/resistance level for an exit point (i.e. stop loss), and…
- If you can’t find it on a given chart, will scaling down to a lower time frame reveal a tradeable level?
Almost all difficult patterns will reveal clear potential setups for a trade OR they will reveal reasons not to trade at all. It helps to know what to look for and how to look for them. Happy trading!
Please be aware that the content of this blog is based upon the opinions and research of GFF Brokers and its staff and should not be treated as trade recommendations. There is a substantial risk of loss in trading futures, options and forex. Past performance is not necessarily indicative of future results.
Be advised that there are instances in which stop losses may not trigger. In cases where the market is illiquid–either no buyers or no sellers–or in cases of electronic disruptions, stop losses can fail. And although stop losses can be considered a risk management (loss management) strategy, their function can never be completely guaranteed.
Disclaimer Regarding Hypothetical Performance Results: HYPOTHETICAL PERFORMANCE RESULTS HAVE MANY INHERENT LIMITATIONS, SOME OF WHICH ARE DESCRIBED BELOW. NO REPRESENTATION IS BEING MADE THAT ANY ACCOUNT WILL OR IS LIKELY TO ACHIEVE PROFITS OR LOSSES SIMILAR TO THOSE SHOWN. IN FACT, THERE ARE FREQUENTLY SHARP DIFFERENCES BETWEEN HYPOTHETICAL PERFORMANCE RESULTS AND THE ACTUAL RESULTS SUBSEQUENTLY ACHIEVED BY ANY PARTICULAR TRADING PROGRAM.
ONE OF THE LIMITATIONS OF HYPOTHETICAL PERFORMANCE RESULTS IS THAT THEY ARE GENERALLY PREPARED WITH THE BENEFIT OF HINDSIGHT. IN ADDITION, HYPOTHETICAL TRADING DOES NOT INVOLVE FINANCIAL RISK, AND NO HYPOTHETICAL TRADING RECORD CAN COMPLETELY ACCOUNT FOR THE IMPACT OF FINANCIAL RISK IN ACTUAL TRADING. FOR EXAMPLE, THE ABILITY TO WITHSTAND LOSSES OR TO ADHERE TO A PARTICULAR TRADING PROGRAM IN SPITE OF TRADING LOSSES ARE MATERIAL POINTS WHICH CAN ALSO ADVERSELY AFFECT ACTUAL TRADING RESULTS. THERE ARE NUMEROUS OTHER FACTORS RELATED TO THE MARKETS IN GENERAL OR TO THE IMPLEMENTATION OF ANY SPECIFIC TRADING PROGRAM WHICH CANNOT BE FULLY ACCOUNTED FOR IN THE PREPARATION OF HYPOTHETICAL PERFORMANCE RESULTS AND ALL OF WHICH CAN ADVERSELY AFFECT ACTUAL TRADING RESULTS.