Many traders perceive that there is a true value for a market– where the price should be–and that if a given asset goes too far above or below this price, it comes back to this fair value range. And this is what the counter-trend trader attempts to capture, the movement of a given asset from its overbought or oversold levels back toward its average price.
Trading Fundamentals vs Noise
On a larger scale, such as a daily or weekly chart, price movements beyond a certain range or deviation are often fundamentally driven, sometimes in response to economic conditions or geopolitical events. But on an intraday level, price movements beyond a standard deviation can sometimes be attributed to market noise, the random result of traders buying and selling based on different underlying strategies or motivations.
Trading the E-Mini Nasdaq During the Opening Range
So, what would this type of trading look like on an intraday basis? As we know, even the most liquid of markets fluctuate throughout the day, most often ending above or below the opening price, and fluctuating (sometimes wildly) before its closing price point.
Let’s use the Bollinger Band strategy that we covered in a previous article to observe a few potential day trades on the NQ. We’ll use a 15-minute chart. Here are the rules:
Conditions:
- Trades cannot be placed within a narrow or flat range; there has to be some level of volatility.
- We’ll use the standard Bollinger Band setting of two standard deviations.
Entries:
- The first of the two setup bars must close outside of the band (whether above or below).
- The second bar must close within the band.
- If going short, place an entry stop below the low of the bar that closed within the band; alternately, if going long, place an entry stop above the high of the bar than closed within the band.
Exits:
- Place stop losses on the opposite end of the entry bar.
- Place your profit target at the nearest support or resistance levels.
Caveat: sometimes the trade scenario will present greater risk-to-reward or greater reward-to-risk potential. Think about this carefully, and proceed with caution.
Hypothetical examples Demonstrating the Technique
NQ (continuous contract) 15-minute chart – April 8, 2019
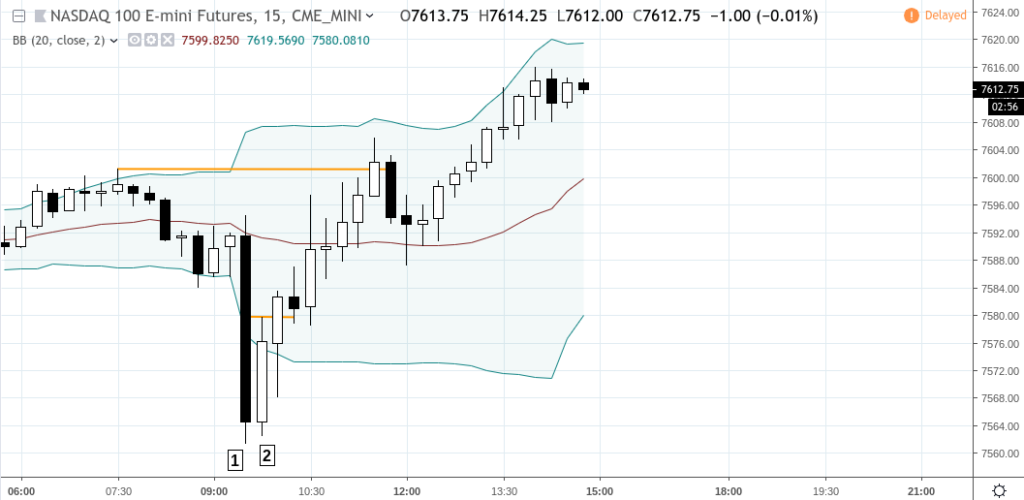
Here’s a potential trade based on today’s price action. The setup bar [1] closed below the band, while the trigger bar [2] closed within the band, the following bar triggering an entry which followed through to the targeted resistance at 7601.25.
Let’s take a look at a few others:
NQ (continuous contract) 15-minute chart – April 5, 2019
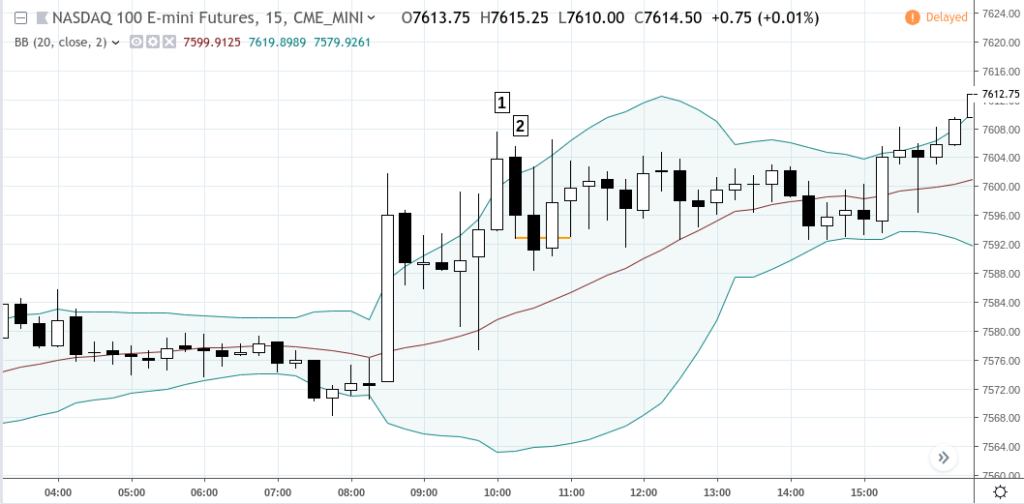
Following the setup bar [1] and trigger bar [2], you can see that this trade eventually go stopped out; a losing trade, emphasizing the importance of money management. If someone would have taken this trade, hopefully that trader would have done so with a position size calculated to match a predetermined risk level.
NQ (continuous contract) 15-minute chart – April 4, 2019
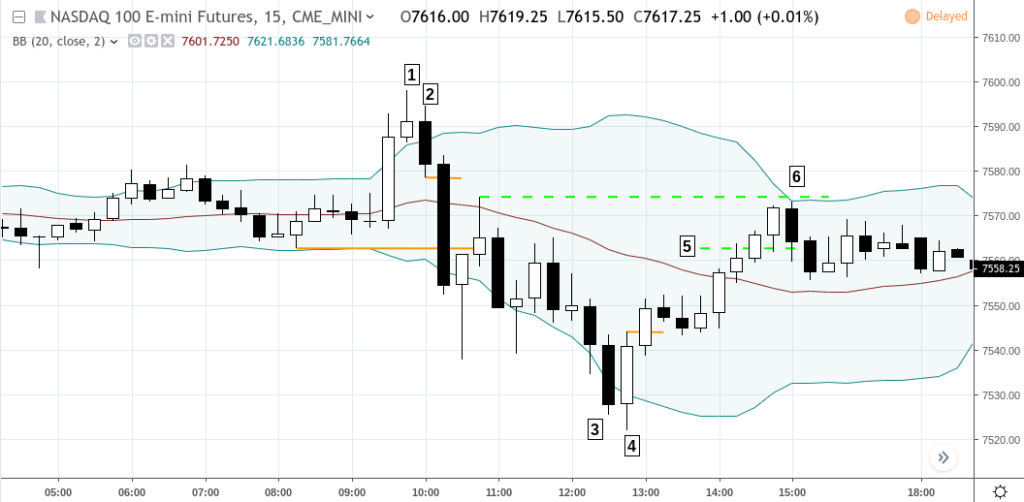
The first trade, setup at [1] and trigger at [2] would have been pretty straightforward; its profit target at the support level of 7562.75.
The second trade was slightly trickier. The setup at [3] and trigger at [4] is clear, but here you would have had two options for a price target. If you had selected the swing high at [6], the NQ would not have reached that level. But if you selected higher support level (go back to 8:15 am ET) of 7562.75 as shown in [5], then you might have reached your target. Remember that support and resistance can both be price targets, as long as those levels are above your price if you are long, or below your price if you are short.
NQ (continuous contract) 15-minute chart – April 3, 2019
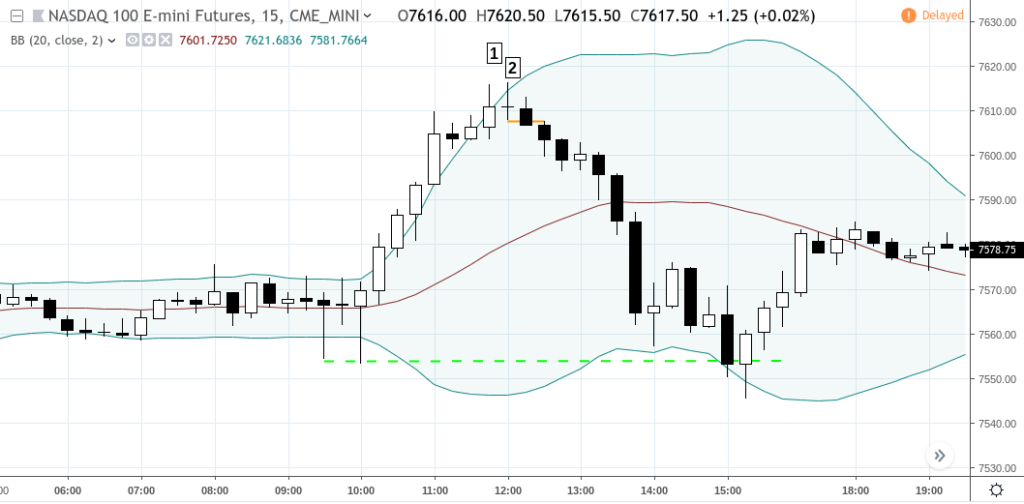
Another clean trade as you can see above. But let’s look at a few unfavorable scenarios, such as this one on April 1, 2019.
NQ (continuous contract) 15-minute chart – April 1, 2019
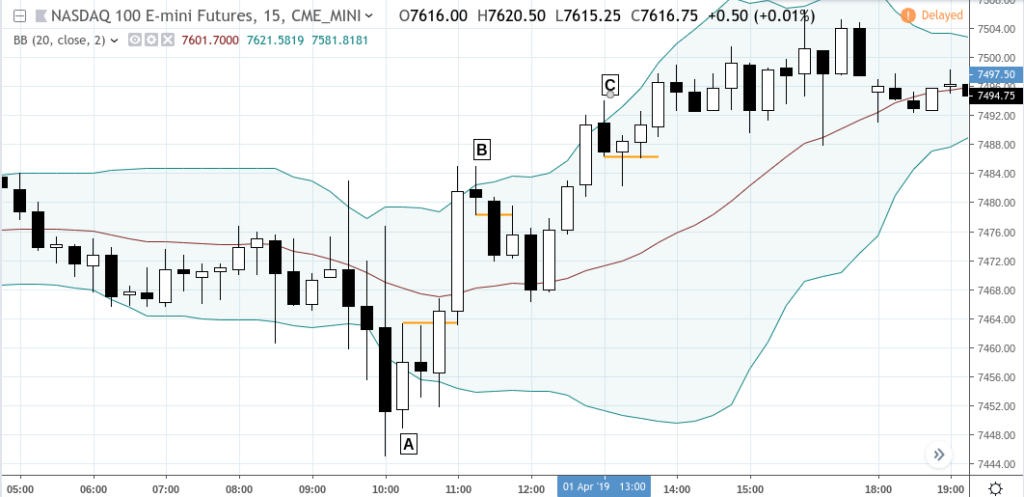
The first trade at [A] was clean and might have yielded a profit.
The second trade at [B] likely didn’t reach a profit target if you had chosen previous support or resistance below the trigger price. It might have afforded you some time to move your stop loss to a breakeven level, otherwise, you might have been stopped out at a loss.
The third trade at [C] might have been a loser, since you would have been stopped out three bars after entry.
Day Trading Against the Opening Breakout Can Be Tricky
As you can see, counter-trend trading can be a risky proposition. But if you decide to do it, remember to setup a system to objectively calculate your entries/exits, and risk/reward.
Please be aware that the content of this blog is based upon the opinions and research of GFF Brokers and its staff and should not be treated as trade recommendations. There is a substantial risk of loss in trading futures, options and forex. Past performance is not necessarily indicative of future results.
Be advised that there are instances in which stop losses may not trigger. In cases where the market is illiquid–either no buyers or no sellers–or in cases of electronic disruptions, stop losses can fail. And although stop losses can be considered a risk management (loss management) strategy, their function can never be completely guaranteed.
Disclaimer Regarding Hypothetical Performance Results: HYPOTHETICAL PERFORMANCE RESULTS HAVE MANY INHERENT LIMITATIONS, SOME OF WHICH ARE DESCRIBED BELOW. NO REPRESENTATION IS BEING MADE THAT ANY ACCOUNT WILL OR IS LIKELY TO ACHIEVE PROFITS OR LOSSES SIMILAR TO THOSE SHOWN. IN FACT, THERE ARE FREQUENTLY SHARP DIFFERENCES BETWEEN HYPOTHETICAL PERFORMANCE RESULTS AND THE ACTUAL RESULTS SUBSEQUENTLY ACHIEVED BY ANY PARTICULAR TRADING PROGRAM.
ONE OF THE LIMITATIONS OF HYPOTHETICAL PERFORMANCE RESULTS IS THAT THEY ARE GENERALLY PREPARED WITH THE BENEFIT OF HINDSIGHT. IN ADDITION, HYPOTHETICAL TRADING DOES NOT INVOLVE FINANCIAL RISK, AND NO HYPOTHETICAL TRADING RECORD CAN COMPLETELY ACCOUNT FOR THE IMPACT OF FINANCIAL RISK IN ACTUAL TRADING. FOR EXAMPLE, THE ABILITY TO WITHSTAND LOSSES OR TO ADHERE TO A PARTICULAR TRADING PROGRAM IN SPITE OF TRADING LOSSES ARE MATERIAL POINTS WHICH CAN ALSO ADVERSELY AFFECT ACTUAL TRADING RESULTS. THERE ARE NUMEROUS OTHER FACTORS RELATED TO THE MARKETS IN GENERAL OR TO THE IMPLEMENTATION OF ANY SPECIFIC TRADING PROGRAM WHICH CANNOT BE FULLY ACCOUNTED FOR IN THE PREPARATION OF HYPOTHETICAL PERFORMANCE RESULTS AND ALL OF WHICH CAN ADVERSELY AFFECT ACTUAL TRADING RESULTS.