Fading the markets is gutsy and it’s counter-intuitive. It is highly risky. And since no investor can definitively identify market bottoms or tops, let alone “timing” a peak or trough, most fail in the attempt.
But, a few do actually succeed. And among those who do succeed, some are just plain lucky, while a small handful of other just happened to fade cautiously.
Getting in near the bottom or top of a market, to respectively go long or short, is one of the most potentially profitable positions to be in, despite also being one of the most risky positions as well.
So the question you might want to ask yourself is “how might I expose myself to more upside than downside if I attempt to fade a market, knowing that I might often be wrong?”.
The first answer to this question is to manage your risk and position size to minimize the probability of blowing up your account. The second answer is to use a few tactical tools and setups to give you a reason to fade and a reference point from which to trade your fade.
Fading the Energy Markets
The last three months of 2018 presented strong reversal setups in all three energy futures markets: crude oil (CL), RBOB gasoline (RB), and natural gas (NG). CL and RB were trending down and reaching new lows, while NG in late November appeared to be reaching new highs. What made for “strong reversal setups” here? In other words, how might you have identified the market’s potential to reverse?
Fundamentals might have provided some clues. But let’s keep this conversation strictly technical. Price action might have given you the tactical setup, but only once you’ve identified the potential reversal warnings. In this case, you might have benefitted from using the standard Relative Strength Index (RSI).
RBOB Gasoline (RB continuous contract) Daily Chart from 9/14/2018 to 3/22/2019
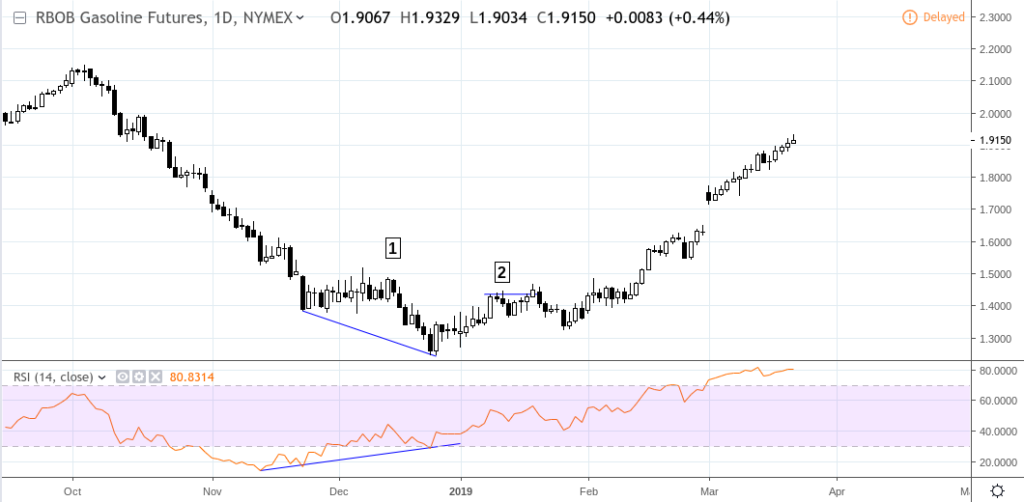
The December 26 bottom for RBOB Gasoline exhibited standard downtrend characteristics (lower lows and lower highs). Aside from any fundamental developments that might have signaled a reversal, the RSI at [1] showed signs of a classic divergence in which RB made a lower low while the RSI reading (already in oversold territory) made a higher low.
Now, bear in mind that RSI divergence signals give indications and NOT guarantees. So if you were in the mind to fade this move, you might have approached it tactically and cautiously. You might have waited for RB to establish a short term “local low,” placing a buy stop order at the breakout, in this case at [2]. You might have also placed a stop loss below the December 26 low. If you had entered RB in this way, you might have minimized your risk while seeking potentially greater upside potential.
A similar thing happened in crude oil.
Crude Oil (CL continuous contract) Daily Chart from 9/21/2018 to 3/22/2019
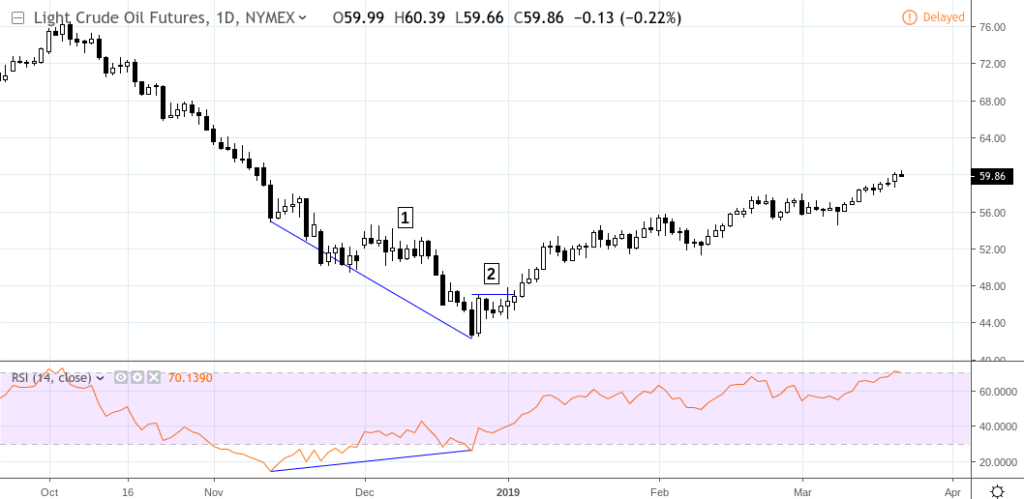
Similar to our RB setup, you have divergence at [1] and a tighter breakout at [2]. Like RB, CL present us with a similar trade opportunity that might have been missed save the RSI indication (or fundamental news).
Let’s take a look at the opposite scenario in natural gas (NG).
Natural Gas (NG continuous contract) Daily Chart from 12/26/2018 to 3/22/2019
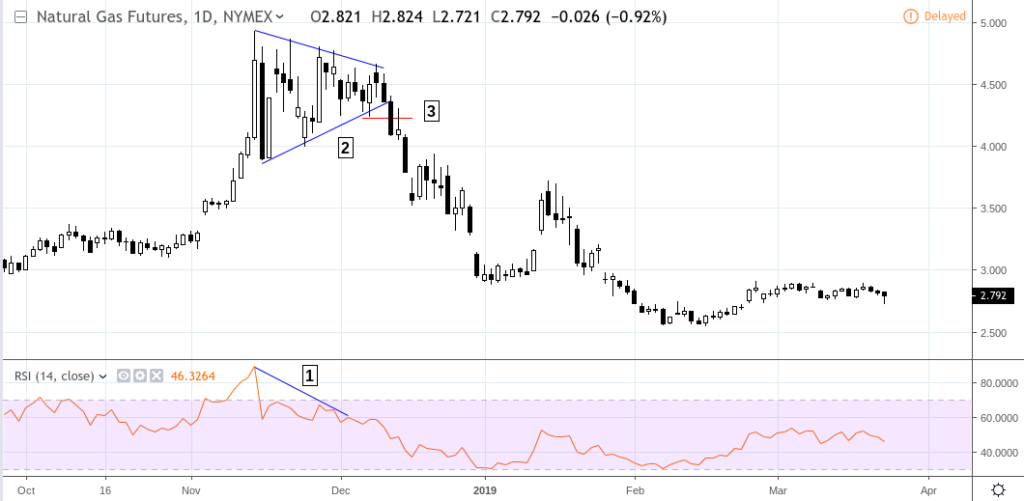
This example differs slightly from the previous examples, not only in the direction of the trade, but in the lack of RSI and price divergence [1], and emergence of a pattern, in this case, a symmetrical triangle at [2]. This is a neutral pattern: the direction of the breakout matters. This is one instance where fundamental information might have been helpful. But the RSI reading, which showed a significant jump below the overbought levels, might have indicated the weakness of the price movement, giving us a technical downside bias. In that case, you might have traded the breakout (or breakdown) of the triangle at [3] (stop loss above the last swing high), which would have placed you in a nice short position.
Using Ockham’s Razor When Using Indicators
Many traders who rely on price action to make trading decisions aren’t necessarily “anti-indicator.” If anything, they abide by a principle that is not unlike the classic “Ockham’s Razor,” which essentially says that simpler solutions are more likely to be correct than complex ones.
There are numerous formulations of this concept. Another formulation, one that comes close to the approach we demonstrated above, says that you shouldn’t multiply the complexity of a solution beyond what’s absolutely necessary. So if an additional indicator or two might help, then add it. But be careful, as you may eventually reach a saturation point where the chart may give conflicting signals due to too many indicators. Then you’re in trouble.
Keep in mind that a simple solution, just like a complex one, still might not work. Not all trades work out. So why complicate the means when nothing is guaranteed? What you might want to do is seek out trades which appear to present a greater return than risk in your favor. And if it doesn’t work out, then on to the next trade.
The RSI and price action combination worked well for the trades we highlighted above. Note that there are other combinations to explore that might achieve something similar. And if you add fundamentals to the mix, then you just might have a comprehensive approach that can give you both a strategic outlook and a tactical means of execution.
Please be aware that the content of this blog is based upon the opinions and research of GFF Brokers and its staff and should not be treated as trade recommendations. There is a substantial risk of loss in trading futures, options and forex. Past performance is not necessarily indicative of future results.
Be advised that there are instances in which stop losses may not trigger. In cases where the market is illiquid–either no buyers or no sellers–or in cases of electronic disruptions, stop losses can fail. And although stop losses can be considered a risk management (loss management) strategy, their function can never be completely guaranteed.
Disclaimer Regarding Hypothetical Performance Results: HYPOTHETICAL PERFORMANCE RESULTS HAVE MANY INHERENT LIMITATIONS, SOME OF WHICH ARE DESCRIBED BELOW. NO REPRESENTATION IS BEING MADE THAT ANY ACCOUNT WILL OR IS LIKELY TO ACHIEVE PROFITS OR LOSSES SIMILAR TO THOSE SHOWN. IN FACT, THERE ARE FREQUENTLY SHARP DIFFERENCES BETWEEN HYPOTHETICAL PERFORMANCE RESULTS AND THE ACTUAL RESULTS SUBSEQUENTLY ACHIEVED BY ANY PARTICULAR TRADING PROGRAM.
ONE OF THE LIMITATIONS OF HYPOTHETICAL PERFORMANCE RESULTS IS THAT THEY ARE GENERALLY PREPARED WITH THE BENEFIT OF HINDSIGHT. IN ADDITION, HYPOTHETICAL TRADING DOES NOT INVOLVE FINANCIAL RISK, AND NO HYPOTHETICAL TRADING RECORD CAN COMPLETELY ACCOUNT FOR THE IMPACT OF FINANCIAL RISK IN ACTUAL TRADING. FOR EXAMPLE, THE ABILITY TO WITHSTAND LOSSES OR TO ADHERE TO A PARTICULAR TRADING PROGRAM IN SPITE OF TRADING LOSSES ARE MATERIAL POINTS WHICH CAN ALSO ADVERSELY AFFECT ACTUAL TRADING RESULTS. THERE ARE NUMEROUS OTHER FACTORS RELATED TO THE MARKETS IN GENERAL OR TO THE IMPLEMENTATION OF ANY SPECIFIC TRADING PROGRAM WHICH CANNOT BE FULLY ACCOUNTED FOR IN THE PREPARATION OF HYPOTHETICAL PERFORMANCE RESULTS AND ALL OF WHICH CAN ADVERSELY AFFECT ACTUAL TRADING RESULTS.