It may seem a bit strange to think that stop loss targets may be easier to identify than profit targets. Traders often place stop losses at support or resistance levels (depending on whether they are going long or short). If price breaks below (or above) these levels, it is commonly taken as a signal that their directional bias may no longer be valid.
But let’s suppose you are in a day trade: your order has been filled and your trade is active. Where might you close your trade? Suppose your trade working out in your favor, and it is currently profitable. Do you let it run, or do you close it out? And if you plan on closing it out, where might you do it, and more importantly, why?
Do you close out at the nearest resistance level? What if you are at all-time-highs and there is no resistance level? Or, what if the nearest resistance level seems either too close or too far? How would you go about assessing either scenario?
Estimating a Profit Target is Not a Science, It’s a Matter of Method and Principle
There are many ways to determine profit targets, most of which may be based on a given trading methodology. But here’s one indicator that might help: Average True Range (ATR). Bear in mind that there are many ways to use ATR. What were about to present–using ATR as a potential indicator of range–is just one way of using it.
Introducing True Range and Average True Range
True Range (TR) is the range that an asset will move within a given time period. So, if an asset moves 50 points in one day, from its highest high to its lowest low, then you have a one-day TR of 50. Say the next day, it moves only 30 points from high to low, then you have a one day TR of 30. Let’s suppose that on the following day, it moves 65 points, a one-day TR of 65. You get it now? Easy right?
So what is the Average True Range your asset over the last three days? Well, 50 + 30 + 65 = 145. Divide that figure by 3 and you get a three-day ATR of 48.33. This means that over the last three days, your asset had moved an “average” of 48.33 points.
Of course, ATR is not a predictive indicator as the next day may bring an ATR that is far greater, far lesser, or near average. But it is an estimate of the average three-day range of your asset.
Using ATR to Anticipate Price Limits
Here’s a 15-minute chart of the December Crude Oil Futures on October 1, 2018. Let’s suppose that your objective is to day trade this contract, and that you intend on buying a breakout of its current price range.
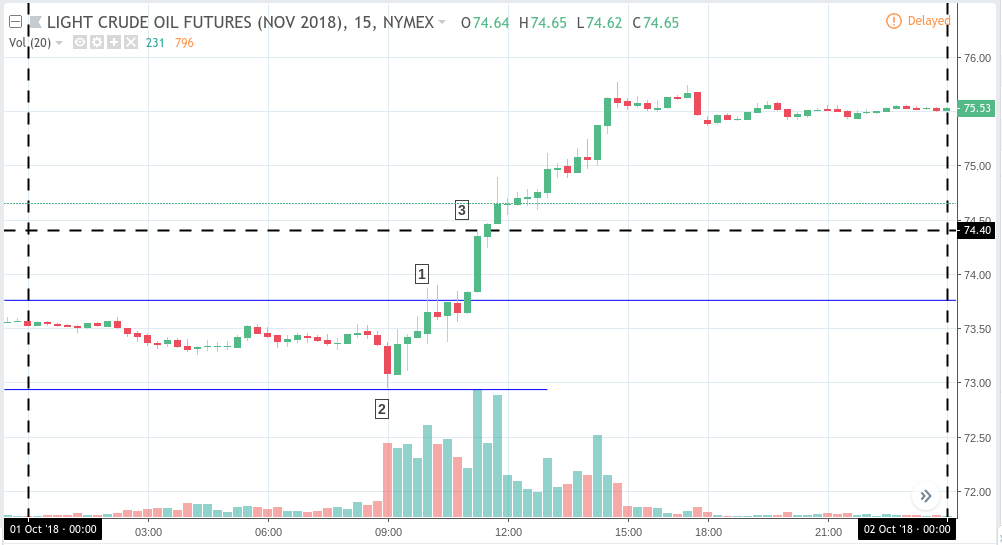
At 10am ET, price indicated a potential breakout from its range (1), the range itself indicated by the upper and lower blue lines. Let’s suppose you placed a buy stop at 73.75, the price point at which the potential breakout occurred. Let’s also suppose that you placed a stop at the bottom of the range, at the price of 72.90.
Note that up to this point, 72.90 was the lowest price at which the CL contract had traded. At 11:15, price moved up significantly. Here is what you are faced with:
- Your trade is moving in your favor; it’s showing a profit.
- You are not sure at which price level to close out your position.
The truth is that we can never predict how far a trade will move either up or down. So often we may have to rely on some methodology that gives us an “exit strategy.”
Here’s one possible way of determining a potential exit. We do a quick assessment of this contract’s ATR. We decide on a 20-day ATR, since that gives us a two-week average of the range at which this contract trades.
Note that default ATR settings are typically at 14 days, but we decided (and this is subjective), that a 20-day ATR may give us enough days to get reasonable average, one that is not as volatile as a 2 to 5 day reading, but one that also gives more weight to recent trading activity than, say, a 1 or 2 month ATR.
The 20-day ATR stands at 1.45. So if the lowest price of 72.90 ends up becoming the lowest low (which it was), then if we were to add 1.45 (the 20-day ATR) to the lowest low, we can project that if price continued to move upward to reach its ATR of 1.45, then that price would be at 74.40 which is indicated by the horizontal dotted line at (3).
What might you do now that price had exceeded its ATR? Here are a couple of possibilities:
- Since your objective is to “day trade” the contract, meaning you intend on getting out of your position before market close, then you might have simply closed your position.
- Another possibility is that you might have trailed your stop below each 15 minute bar until you were stopped out.
- And yet another option would be to wait until a few minutes before market close before finally closing your position.
The ATR provided a reference point to help you decide when exactly to close your position.
As with most indicators, the ATR is not a predictive indicator. But that’s not how we’re using it in this scenario. It’s simply a reference point. Having reference points to indicate potential entries or exits can help you avoid the alternative, which is to trade blindly with no sense of where you are going.
Please be aware that the content of this blog is based upon the opinions and research of GFF Brokers and its staff and should not be treated as trade recommendations. There is a substantial risk of loss in trading futures, options and forex. Past performance is not necessarily indicative of future results.
Disclaimer Regarding Hypothetical Performance Results: HYPOTHETICAL PERFORMANCE RESULTS HAVE MANY INHERENT LIMITATIONS, SOME OF WHICH ARE DESCRIBED BELOW. NO REPRESENTATION IS BEING MADE THAT ANY ACCOUNT WILL OR IS LIKELY TO ACHIEVE PROFITS OR LOSSES SIMILAR TO THOSE SHOWN. IN FACT, THERE ARE FREQUENTLY SHARP DIFFERENCES BETWEEN HYPOTHETICAL PERFORMANCE RESULTS AND THE ACTUAL RESULTS SUBSEQUENTLY ACHIEVED BY ANY PARTICULAR TRADING PROGRAM.
ONE OF THE LIMITATIONS OF HYPOTHETICAL PERFORMANCE RESULTS IS THAT THEY ARE GENERALLY PREPARED WITH THE BENEFIT OF HINDSIGHT. IN ADDITION, HYPOTHETICAL TRADING DOES NOT INVOLVE FINANCIAL RISK, AND NO HYPOTHETICAL TRADING RECORD CAN COMPLETELY ACCOUNT FOR THE IMPACT OF FINANCIAL RISK IN ACTUAL TRADING. FOR EXAMPLE, THE ABILITY TO WITHSTAND LOSSES OR TO ADHERE TO A PARTICULAR TRADING PROGRAM IN SPITE OF TRADING LOSSES ARE MATERIAL POINTS WHICH CAN ALSO ADVERSELY AFFECT ACTUAL TRADING RESULTS. THERE ARE NUMEROUS OTHER FACTORS RELATED TO THE MARKETS IN GENERAL OR TO THE IMPLEMENTATION OF ANY SPECIFIC TRADING PROGRAM WHICH CANNOT BE FULLY ACCOUNTED FOR IN THE PREPARATION OF HYPOTHETICAL PERFORMANCE RESULTS AND ALL OF WHICH CAN ADVERSELY AFFECT ACTUAL TRADING RESULTS.