When volatility ramps up, markets can get exceedingly trickier to trade. Which side of the market (buying or selling) might provide better trading opportunities? Should you go long or short? What might be a good price point to enter or exit a trade?
As you know, it’s impossible to definitively predict where the market is going next. But you can set up certain criteria to help you select entry and exit points. You may not always be right, but you can at least evaluate your potential risk and return, taking action based on reasonable calculations and a guided sense of direction.
Here’s a relatively old setup that was developed and popularized by famed trader, Joe Ross. It’s called the camelback technique. It’s purpose is to help you identify and trade on the “right side of the market” based on recent price movement (reminder: it can change). Here are the rules:
For Long Trades:
- Price is above a 40-period simple moving average high/low channel.
- A 15-period exponential moving average is sloping upward (not flat or negative)
- A lower low takes place, forming the “signal bar.”
- Buy one tick above the high of the signal bar.
For Short Trades:
- Price is below a 40-period simple moving average high/low channel.
- A 15-period exponential moving average is sloping downward (not flat or negative)
- A higher high takes place, forming the “signal bar.”
- Sell one tick below the low of the signal bar.
A few variables regarding profit targets and stop losses
Profit targets will vary depending on your preference and risk tolerance as a trader. For instance, do you close at the end of the day, trail a stop to breakeven (assuming the trade is profitable), do you close the position at a predetermined percentage of gain, or do you wait for it to reach a certain percentage of return-to-risk (i.e. 1:1, 2:1, or 3:1, etc.?
Stop loss placements will also vary depending on your preference. Do you place a stop loss below (or above, if short) the low (or high) of the signal bar, or do you place a stop below (or above) the 40-period moving average channel, or the previous swing low? It all depends on your risk tolerance, your amount of risk capital, and your preferred time frame for holding a trade.
Long Trade Example
Here’s a hypothetical example of long trade setups on the YM.
- Numbers indicate the signal bar.
- Arrows indicate hypothetical trades.
YM (continuous contract) daily chart from July 6 to September 18, 2018
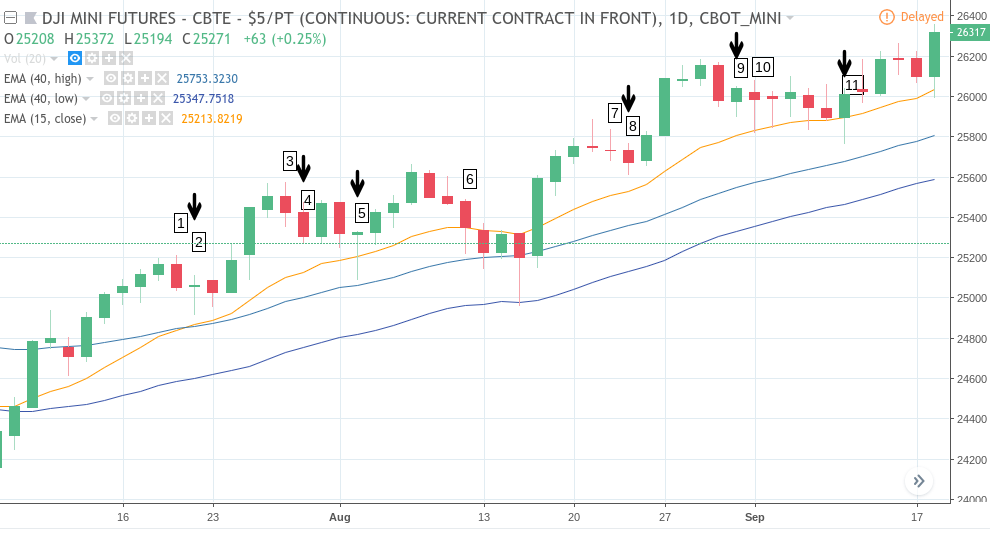
- The high was not exceeded, so we’ll assume that in every similar scenario, there was no trade.
- Order might have been filled two session later; potential profit depends on how long you might have held onto the position.
- No trade.
- Order might have been filled, but depending on your stop loss, the trade might have been stopped out at a loss.
- Order might have been filled and the trade might have been profitable.
- 15-EMA is sloping downward, cancelling the setup.
- No trade.
- Order might have been and potentially profitable.
- Order might have been and potentially stopped out at a loss.
- No trade.
- Order might have been and potentially profitable.
As you can see, there are still plenty of variables in play, giving the technique some room for trader interpretation and discretion. The entries are clear but the exits on the side of profit or loss are unspecified. This is by no means a closed or even complete “system;” this approach simply provides a method for you to identify a possible trend, identify a pullback within that trend, and place a buy or sell order based on a set of rules. Hopefully, this setup can keep you on the “right side of a market” as it was designed to do. And like every technique, it’s not always accurate. But it does provide a relatively clear perspective…at least with regard to trade entries.
As a trader, you might want to determine whether such an approach might be helpful to your trading. And if you feel that it might help you select better trade entries, be sure to fill in the blanks with regards to trade exits. This technique is somewhat open to variation, giving you some room to build on it according to your own trading style.
Please be aware that the content of this blog is based upon the opinions and research of GFF Brokers and its staff and should not be treated as trade recommendations. T Be advised that there are instances in which stop losses may not trigger. In cases where the market is illiquid–either no buyers or no sellers–or in cases of electronic disruptions, stop losses can fail. And although stop losses can be considered a risk management (loss management) strategy, their function can never be completely guaranteed. There is a substantial risk of loss in trading futures, options and forex. Past performance is not necessarily indicative of future results.
Disclaimer Regarding Hypothetical Performance Results: HYPOTHETICAL PERFORMANCE RESULTS HAVE MANY INHERENT LIMITATIONS, SOME OF WHICH ARE DESCRIBED BELOW. NO REPRESENTATION IS BEING MADE THAT ANY ACCOUNT WILL OR IS LIKELY TO ACHIEVE PROFITS OR LOSSES SIMILAR TO THOSE SHOWN. IN FACT, THERE ARE FREQUENTLY SHARP DIFFERENCES BETWEEN HYPOTHETICAL PERFORMANCE RESULTS AND THE ACTUAL RESULTS SUBSEQUENTLY ACHIEVED BY ANY PARTICULAR TRADING PROGRAM.
ONE OF THE LIMITATIONS OF HYPOTHETICAL PERFORMANCE RESULTS IS THAT THEY ARE GENERALLY PREPARED WITH THE BENEFIT OF HINDSIGHT. IN ADDITION, HYPOTHETICAL TRADING DOES NOT INVOLVE FINANCIAL RISK, AND NO HYPOTHETICAL TRADING RECORD CAN COMPLETELY ACCOUNT FOR THE IMPACT OF FINANCIAL RISK IN ACTUAL TRADING. FOR EXAMPLE, THE ABILITY TO WITHSTAND LOSSES OR TO ADHERE TO A PARTICULAR TRADING PROGRAM IN SPITE OF TRADING LOSSES ARE MATERIAL POINTS WHICH CAN ALSO ADVERSELY AFFECT ACTUAL TRADING RESULTS. THERE ARE NUMEROUS OTHER FACTORS RELATED TO THE MARKETS IN GENERAL OR TO THE IMPLEMENTATION OF ANY SPECIFIC TRADING PROGRAM WHICH CANNOT BE FULLY ACCOUNTED FOR IN THE PREPARATION OF HYPOTHETICAL PERFORMANCE RESULTS AND ALL OF WHICH CAN ADVERSELY AFFECT ACTUAL TRADING RESULTS.