If you were trading the ES in the week leading up to May 1, 2019, you might have found yourself in a shaky and undecidable position. The unknowns–and there were lots of them–included the following:
- The S&P 500 was at 2956.50, which was an all-time-highs; having broken above its September record high of 2947.00 just a day ago.
- A month into earnings season, around 75% of all S&P 500 companies have beaten earnings expectations, suggesting a healthy fundamental environment.
- The Federal reserve was about to announce its decision on interest rates…
- There was the ongoing US-China trade war
- The market was seemingly reacting off President Trump’s tweets, perhaps even more so than market fundamentals; so you wondered is he going to tweet anything that might support or take down the markets?
If you were looking at fundamentals for certainty in this highly uncertain environment, then any economic or geopolitical data might have just added more to the confusion.
Fortunately, as the S&P 500 broke above its third record high since January 2018, there was one way to gauge the strength of the rally: checking price momentum against the Relative Strength Index (RSI) but on a weekly scale, which is a time frame that some swing traders and only a few day traders tend to reference.
Weekly Divergence Between ES Price and RSI Readings
ES (continuous contract) – Weekly chart – January 2017 to April 2019
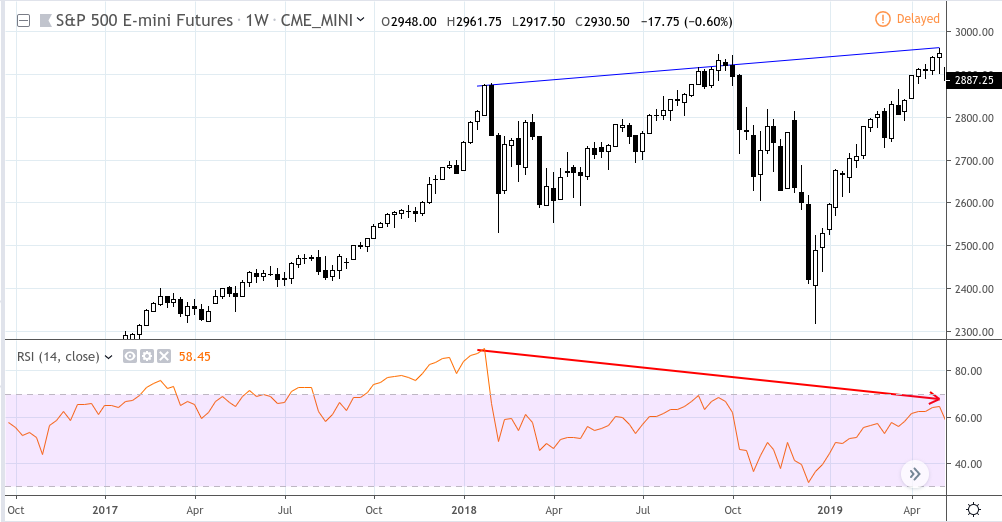
Taking a look at the three highs–January and September 2018, and now April 29, 2019–you can see that as price was rallying in each instance, the RSI revealed a waning momentum.
Given the strong US economy amidst the increasingly uncertain geopolitical situation, such a technical reading was a mere indication, but one that might have appeared blatant enough to warn any trader of the possibility of price exhaustion, however temporary it might have been.
So if you had seen this technical reading, what might have you done?
ES (continuous contract) – Daily chart – March 20 to June 18, 2019
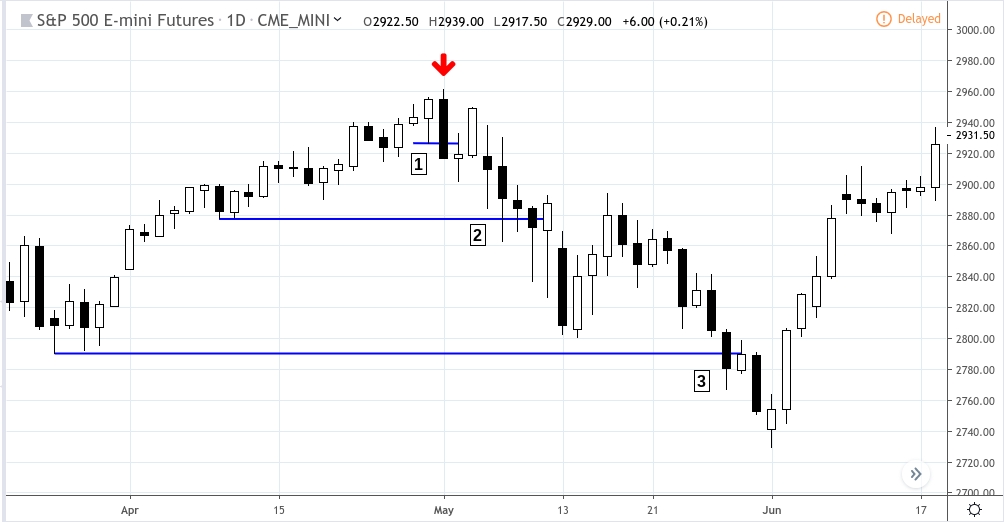
Assuming that you held a bearish bias in light of the weekly RSI and price divergence, you might have:
- Placed a sell stop (short entry) below the previous day’s (April 30) low as shown at [1] and a buy stop (stop loss) above its high should the Fed (or Trump) say anything that would cause the market to rally.
- The Fed’s statement caused the market to drop as it indicated uncertainty with regard to further rate cuts, an answer that neither Wall Street nor Trump thought favorable.
- As a swing trader, you might have sought the “low hanging fruit” with regard to price targets, the first target being the April 9 and 10 swing low as shown at [2].
- A third target, might have been the March 25 to 28 swing low “range” as shown at [3], though this target might only have been reached if you didn’t close your position when price “corrected” upward before continuing to decline, hitting the third target on May 29, 2019.
Conclusion: If you are a short-term trader, consider the possibility that sometimes the “bigger picture” can’t be seen in short-term price action. Sometimes, you might get a more accurate reading of the markets by following the fundamental environment. In this case, that might not have helped much. But jumping to the larger time frame–allowing you to see the bigger trend–can sometimes provide you with a clearer directional bias. In the case of the S&P 500, the signals might have been more clear if you had checked price against momentum (in this case, the RSI).
Please be aware that the content of this blog is based upon the opinions and research of GFF Brokers and its staff and should not be treated as trade recommendations. There is a substantial risk of loss in trading futures, options and forex. Past performance is not necessarily indicative of future results.
Be advised that there are instances in which stop losses may not trigger. In cases where the market is illiquid–either no buyers or no sellers–or in cases of electronic disruptions, stop losses can fail. And although stop losses can be considered a risk management (loss management) strategy, their function can never be completely guaranteed.
Disclaimer Regarding Hypothetical Performance Results: HYPOTHETICAL PERFORMANCE RESULTS HAVE MANY INHERENT LIMITATIONS, SOME OF WHICH ARE DESCRIBED BELOW. NO REPRESENTATION IS BEING MADE THAT ANY ACCOUNT WILL OR IS LIKELY TO ACHIEVE PROFITS OR LOSSES SIMILAR TO THOSE SHOWN. IN FACT, THERE ARE FREQUENTLY SHARP DIFFERENCES BETWEEN HYPOTHETICAL PERFORMANCE RESULTS AND THE ACTUAL RESULTS SUBSEQUENTLY ACHIEVED BY ANY PARTICULAR TRADING PROGRAM.
ONE OF THE LIMITATIONS OF HYPOTHETICAL PERFORMANCE RESULTS IS THAT THEY ARE GENERALLY PREPARED WITH THE BENEFIT OF HINDSIGHT. IN ADDITION, HYPOTHETICAL TRADING DOES NOT INVOLVE FINANCIAL RISK, AND NO HYPOTHETICAL TRADING RECORD CAN COMPLETELY ACCOUNT FOR THE IMPACT OF FINANCIAL RISK IN ACTUAL TRADING. FOR EXAMPLE, THE ABILITY TO WITHSTAND LOSSES OR TO ADHERE TO A PARTICULAR TRADING PROGRAM IN SPITE OF TRADING LOSSES ARE MATERIAL POINTS WHICH CAN ALSO ADVERSELY AFFECT ACTUAL TRADING RESULTS. THERE ARE NUMEROUS OTHER FACTORS RELATED TO THE MARKETS IN GENERAL OR TO THE IMPLEMENTATION OF ANY SPECIFIC TRADING PROGRAM WHICH CANNOT BE FULLY ACCOUNTED FOR IN THE PREPARATION OF HYPOTHETICAL PERFORMANCE RESULTS AND ALL OF WHICH CAN ADVERSELY AFFECT ACTUAL TRADING RESULTS.