Corn futures may not be among the most popular of instruments for short-term trading. But there are times when the less popular markets present the clearer trading opportunities. It’s a matter of thinking differently from the crowd and seeking opportunities in areas of the market that crowd-followers tend to underestimate.
From May 28 to June 11, 2019, ZC exhibited a classic falling wedge pattern that most swing traders might have identified as a clear set-up.
If you are not familiar with the falling wedge, here’s a brief description. The falling wedge, generally considered a bullish pattern, is characterized by a narrowing downtrend. Price forms a downward-sloping “wedge”–its highs and lows moving lower appear to be converging toward a sharp point.
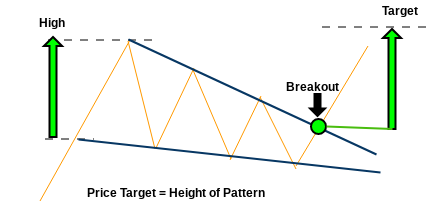
When you see a falling wedge, traders generally anticipate a breakout before the point of trend line convergence. Once a breakout occurs (assuming that the pattern doesn’t fail), you might expect price to reach at least the same vertical distance as the height of the entire wedge pattern (see vertical lines in the image above). This vertical expectation is one way to plot a simple price target.
Now, let’s take a closer look at what had happened in the corn futures market from late April leading up to the June 11 wedge.
Divergence and Breakout
For those of you who were following the corn market in April, you might have noticed that the consecutive lower lows in corn prices from April to May coincided with a divergent reading in the RSI. Typically, such a divergence signals the likelihood of a trend reversal. In this scenario, you would have been looking for a price breakout toward the upside.
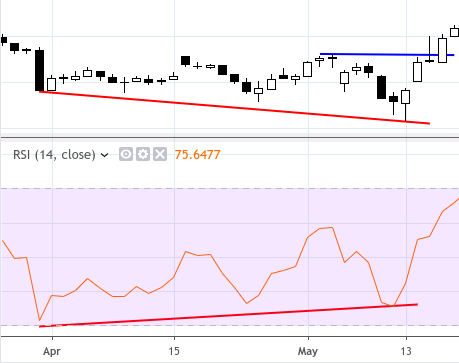
ZC (continuous contract) – Daily chart, March 27 to May 18, 2019
As you can see in the chart above, ZC reversed course on May 15, just three days after the last divergence signal, marking the onset of a new uptrend.
Falling Wedge Pattern Emerges
Following the May 15 breakout, corn futures surged during six out of the seven consecutive trading sessions. On May 29, prices began to pull back, forming the vertical base of an emerging wedge.
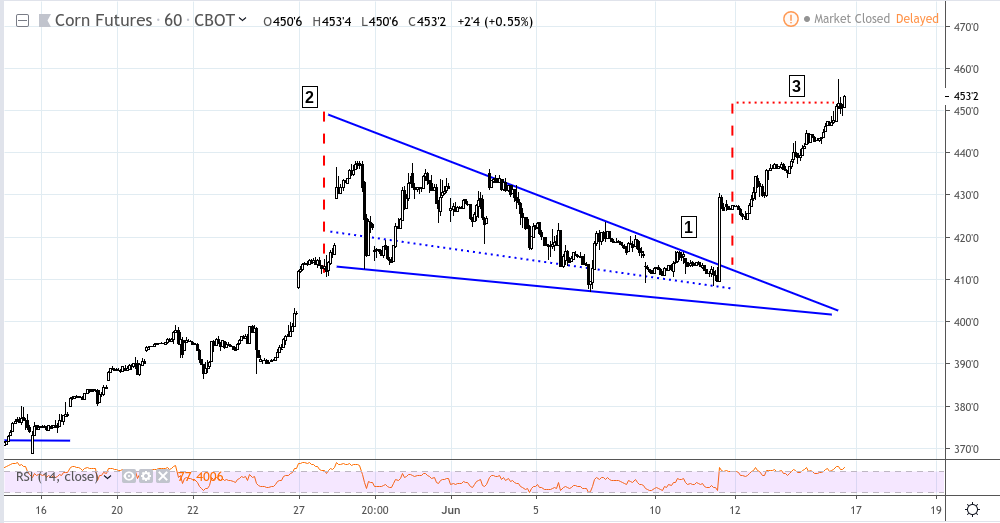
ZC (continuous contract) – 60-minute chart, May 15 to June 14, 2019
The blue trend lines in the image above highlight form the falling wedge. This pattern is traditionally considered bullish. But as with all technical patterns, there’s a possibility that the pattern might fail, so it’s always important to mind the possibility of a busted pattern.
A breakout [1] took place on June 11. If you went long the breakout, one way to have set a profit target would have been to measure the relative height of the pattern as shown at [2]. You might have taken this measurement and applied it to the breakout price level as shown at [3]. The profit target was finally reached on June 14.
Now here’s something to think about: should the fundamentals remain favorable to a price rise in the corn market, then price certainly can go much higher. If you are concerned about “letting winners run,” as the maxim goes, then you might want to use a different method toward setting a higher price target (whether technical or fundamental). But for the purpose of this article, we’re focusing specifically on a short-term swing trade using a classic tactic for getting in and out of a trade.
Every now and then, these classic patterns tend to pop up, as it recently had in the corn futures market. And if you are able to identify these classic patterns, then you might have a scenario whose risk and profit potential has some historical context, making the trade itself a bit simpler to implement, although there are no guarantees. While you may have a preference of trading certain markets, it is worth keeping a watch on a broader range of markets should a classic pattern like this present itself.
Please be aware that the content of this blog is based upon the opinions and research of GFF Brokers and its staff and should not be treated as trade recommendations. There is a substantial risk of loss in trading futures, options and forex. Past performance is not necessarily indicative of future results.
Disclaimer Regarding Hypothetical Performance Results: HYPOTHETICAL PERFORMANCE RESULTS HAVE MANY INHERENT LIMITATIONS, SOME OF WHICH ARE DESCRIBED BELOW. NO REPRESENTATION IS BEING MADE THAT ANY ACCOUNT WILL OR IS LIKELY TO ACHIEVE PROFITS OR LOSSES SIMILAR TO THOSE SHOWN. IN FACT, THERE ARE FREQUENTLY SHARP DIFFERENCES BETWEEN HYPOTHETICAL PERFORMANCE RESULTS AND THE ACTUAL RESULTS SUBSEQUENTLY ACHIEVED BY ANY PARTICULAR TRADING PROGRAM.
ONE OF THE LIMITATIONS OF HYPOTHETICAL PERFORMANCE RESULTS IS THAT THEY ARE GENERALLY PREPARED WITH THE BENEFIT OF HINDSIGHT. IN ADDITION, HYPOTHETICAL TRADING DOES NOT INVOLVE FINANCIAL RISK, AND NO HYPOTHETICAL TRADING RECORD CAN COMPLETELY ACCOUNT FOR THE IMPACT OF FINANCIAL RISK IN ACTUAL TRADING. FOR EXAMPLE, THE ABILITY TO WITHSTAND LOSSES OR TO ADHERE TO A PARTICULAR TRADING PROGRAM IN SPITE OF TRADING LOSSES ARE MATERIAL POINTS WHICH CAN ALSO ADVERSELY AFFECT ACTUAL TRADING RESULTS. THERE ARE NUMEROUS OTHER FACTORS RELATED TO THE MARKETS IN GENERAL OR TO THE IMPLEMENTATION OF ANY SPECIFIC TRADING PROGRAM WHICH CANNOT BE FULLY ACCOUNTED FOR IN THE PREPARATION OF HYPOTHETICAL PERFORMANCE RESULTS AND ALL OF WHICH CAN ADVERSELY AFFECT ACTUAL TRADING RESULTS.