The MACD wasn’t originally designed for day trading or scalping. It was intended for longer-term traders and investors. Still, this makes the MACD indicator a tempting tool for developing ultra-short term strategies if only because it may be an indicator that other day traders and scalpers might not use as often.
Here are a few strategies to consider, test, and tweak.
Scalping the MACD Line
The first strategy is to take a position when there is a turn in the MACD line. This may be risky, considering that any change in the line may reverse if price also reverses. Still, this is where the “lagging” nature of this indicator may prove helpful, as the MACD line will not change until price has reversed to the extent that it can effect a change in “average price.”
Normally, the indicator is used when there is either a crossover between the MACD and the Signal line, or a crossover between the MACD line and the zero line. Here, since the trader is looking for very quick entries and exits, using the turn of the MACD line could have potential.
On the 15-minute XAUUSD chart below, there are six MACD signals, three short positions and three long positions as seen by the arrows in this hypothetical scenario. As we can see in the hypothetical example below, most of them give positive results for the scalper who is looking to get in and out of the trade in a matter of minutes.
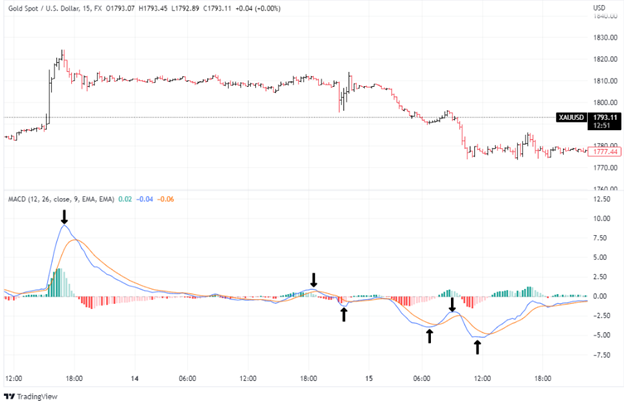
Beware that there can be a lot of whipsaws in these short-time frame charts. And while it gave us positive results here in this hypothetical example above, it can be quite detrimental at other times.
To avoid getting whipsawed, a strategy to consider is to take action on the turns only when the MACD line has traveled far above or below the zero line.
In the hypothetical example below: looking at the same chart as before, we have placed a line at the +4 and the -4 levels on the MACD and this time, there are only two signals instead of six. The goal of this change is to increase the probability that the position will turn out to be a winner, even if we might miss out on some other opportunities.
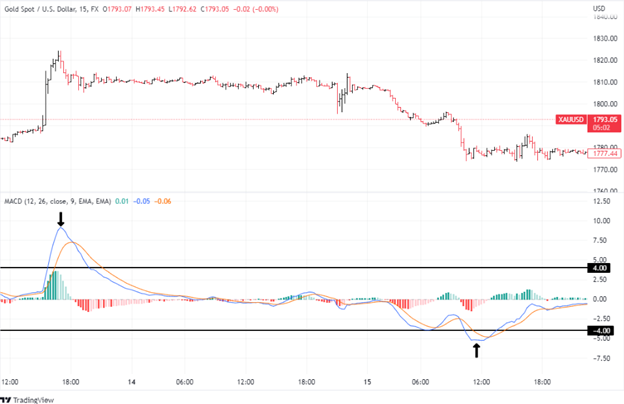
Comparing the 2 hypothetical approaches above, it is up to the trader to decide between a more or less conservative approach.
MACD + Candlestick Patterns to Fine-Tune Scalps
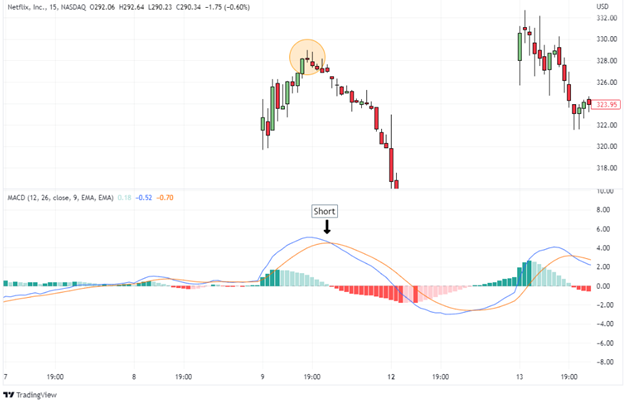
Another strategy is to combine the MACD and other technical tools. In the 15-minute chart below, we used the MACD and candlestick patterns to hypothetically enter a position.
First, following a rise in prices, a doji candlestick appeared, which was the first signal for traders that a change might be coming.
A doji is when a candle opens and closes at the same level, showing indecision. Shortly after, a crossover between the MACD line and the signal line occurred from above, confirming our initial thought and giving us the potential trigger to go short.
Let’s take a look at another example below.
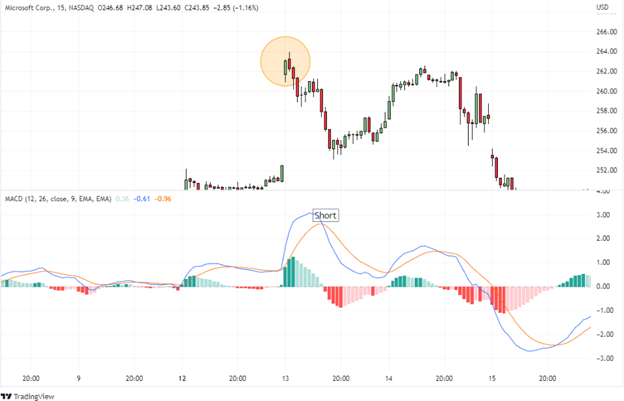
On this chart, a dark cloud cover was followed by a MACD Line-Signal Line crossover, giving us the needed confirmation to potentially go short in this hypothetical trade setup.
A dark cloud cover occurs when, after opening above the previous close, a candle retraces and closes back below the midpoint of the previous candle, a bearish signal. Of course, to be able to use this strategy, the trader should also be familiar with many different technical analysis tools and combine them together.
The Bottom Line
As we can see, just because the MACD was designed specifically for medium to long term charts doesn’t mean that a trader can’t appropriate it for shorter-term trades. It’s up to you and your creativity to discover ways to alter the nature of these technical tools to serve your trading purposes. “Reinventing” an indicator’s use is what system developers do. And if you are successful in doing this, then you may be on the right path to secure a personal trading edge over those who would rather not go the extra mile.
Please be aware that the content of this blog is based upon the opinions and research of GFF Brokers and its staff and should not be treated as trade recommendations. There is a substantial risk of loss in trading futures, options and forex. Past performance is not necessarily indicative of future results.
Disclaimer Regarding Hypothetical Performance Results: HYPOTHETICAL PERFORMANCE RESULTS HAVE MANY INHERENT LIMITATIONS, SOME OF WHICH ARE DESCRIBED BELOW. NO REPRESENTATION IS BEING MADE THAT ANY ACCOUNT WILL OR IS LIKELY TO ACHIEVE PROFITS OR LOSSES SIMILAR TO THOSE SHOWN. IN FACT, THERE ARE FREQUENTLY SHARP DIFFERENCES BETWEEN HYPOTHETICAL PERFORMANCE RESULTS AND THE ACTUAL RESULTS SUBSEQUENTLY ACHIEVED BY ANY PARTICULAR TRADING PROGRAM.
ONE OF THE LIMITATIONS OF HYPOTHETICAL PERFORMANCE RESULTS IS THAT THEY ARE GENERALLY PREPARED WITH THE BENEFIT OF HINDSIGHT. IN ADDITION, HYPOTHETICAL TRADING DOES NOT INVOLVE FINANCIAL RISK, AND NO HYPOTHETICAL TRADING RECORD CAN COMPLETELY ACCOUNT FOR THE IMPACT OF FINANCIAL RISK IN ACTUAL TRADING. FOR EXAMPLE, THE ABILITY TO WITHSTAND LOSSES OR TO ADHERE TO A PARTICULAR TRADING PROGRAM IN SPITE OF TRADING LOSSES ARE MATERIAL POINTS WHICH CAN ALSO ADVERSELY AFFECT ACTUAL TRADING RESULTS. THERE ARE NUMEROUS OTHER FACTORS RELATED TO THE MARKETS IN GENERAL OR TO THE IMPLEMENTATION OF ANY SPECIFIC TRADING PROGRAM WHICH CANNOT BE FULLY ACCOUNTED FOR IN THE PREPARATION OF HYPOTHETICAL PERFORMANCE RESULTS AND ALL OF WHICH CAN ADVERSELY AFFECT ACTUAL TRADING RESULTS.