The MACD (Moving Average Convergence-Divergence) indicator is one of the most well-known and used oscillators in technical analysis, especially for swing traders who take short-term and medium term positions which can span several days to a few weeks.
While there are several ways swing traders can use the MACD, we will go over a few of the more common ones here.
The MACD Divergence Strategy
The first one, which is not exclusive to the MACD and can also be used with other oscillators, is the divergence strategy.
In this approach, the peaks and valleys in the MACD are compared with the peaks and valleys of the price line to find points at which the oscillator is not in agreement with the current price trend.
Typically, a new high in price would be accompanied with a new high in the MACD line, and a new low with a new low. But when the two are moving in opposite directions, we have a divergence, which gives us an early signal that a potential change in direction is imminent.
Looking at the chart below, a clear divergence can be spotted, as the decline in prices was not met with a decline in MACD. Soon after, prices started bottoming and a rally ensued. While a divergence does not mean that a position should be taken immediately, it gives a warning. If the trader was short, spotting a divergence could be a signal to close your short position (hopefully, with a positive return).
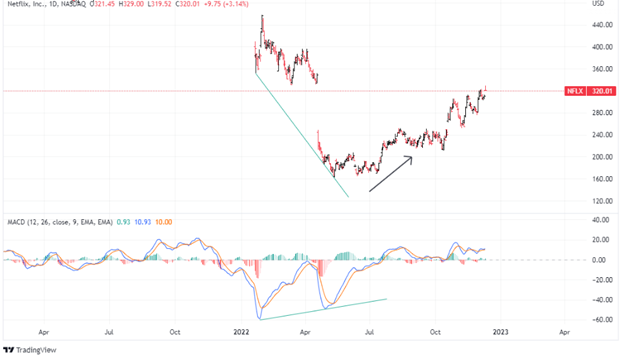
Gerald Appel (the MACD’s developer) himself said that divergences provide the strongest buy and sell signals. While this is not always the case, its historical consistency has shown that such a reading is reliable enough to anticipate.
MACD Crossovers
Another strategy that can be used, which is simpler but can be more high risk, is to buy when the MACD line crosses above the zero line, and to sell in the opposite case.
Since the MACD line is the difference between two moving averages, it is the same strategy as a two moving averages crossover strategy.
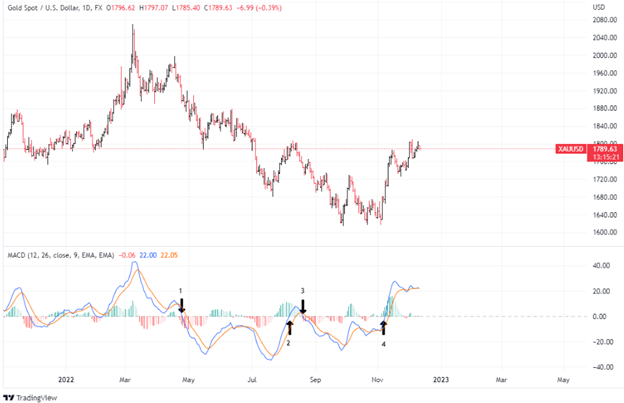
Let’s look at the Gold chart below. During the time frame in the chart below, there were four signals in total, with three of those hypothetically giving us winning trades. While taking a position on the crossover of the MACD line and the Signal line can potentially help us enter the trade earlier, waiting for a break above and below the zero line is intended to ensure that a trend is surely in place, and hopefully limits the whipsaws. Of course, we will still encounter false signals, as was on signal number 2 initiated here, which would have given us a losing trade. In this example, we were able to get out of the trade associated with signal number 2 relatively quickly, therefore limiting the losses in this hypothetical scenario.
The Bottom Line
These are just two strategies that can be used for swing trading using the MACD, and a wise trader would likely combine the signals given here with other indicators as well.
There are plenty more to test and tweak. Refer to our previous “explainer” article to get a few more ideas. Remember that developing an effective trading strategy often involves using common indicators in novel ways. This will take time and plenty of trial and error. But if you are able to find a way to use the MACD in different contexts or in combination with other indicators, then it may be worth the effort, particularly if it’s a favorable strategy that isn’t being used by a large majority of traders.
Please be aware that the content of this blog is based upon the opinions and research of GFF Brokers and its staff and should not be treated as trade recommendations. There is a substantial risk of loss in trading futures, options and forex. Past performance is not necessarily indicative of future results.
Disclaimer Regarding Hypothetical Performance Results: HYPOTHETICAL PERFORMANCE RESULTS HAVE MANY INHERENT LIMITATIONS, SOME OF WHICH ARE DESCRIBED BELOW. NO REPRESENTATION IS BEING MADE THAT ANY ACCOUNT WILL OR IS LIKELY TO ACHIEVE PROFITS OR LOSSES SIMILAR TO THOSE SHOWN. IN FACT, THERE ARE FREQUENTLY SHARP DIFFERENCES BETWEEN HYPOTHETICAL PERFORMANCE RESULTS AND THE ACTUAL RESULTS SUBSEQUENTLY ACHIEVED BY ANY PARTICULAR TRADING PROGRAM.
ONE OF THE LIMITATIONS OF HYPOTHETICAL PERFORMANCE RESULTS IS THAT THEY ARE GENERALLY PREPARED WITH THE BENEFIT OF HINDSIGHT. IN ADDITION, HYPOTHETICAL TRADING DOES NOT INVOLVE FINANCIAL RISK, AND NO HYPOTHETICAL TRADING RECORD CAN COMPLETELY ACCOUNT FOR THE IMPACT OF FINANCIAL RISK IN ACTUAL TRADING. FOR EXAMPLE, THE ABILITY TO WITHSTAND LOSSES OR TO ADHERE TO A PARTICULAR TRADING PROGRAM IN SPITE OF TRADING LOSSES ARE MATERIAL POINTS WHICH CAN ALSO ADVERSELY AFFECT ACTUAL TRADING RESULTS. THERE ARE NUMEROUS OTHER FACTORS RELATED TO THE MARKETS IN GENERAL OR TO THE IMPLEMENTATION OF ANY SPECIFIC TRADING PROGRAM WHICH CANNOT BE FULLY ACCOUNTED FOR IN THE PREPARATION OF HYPOTHETICAL PERFORMANCE RESULTS AND ALL OF WHICH CAN ADVERSELY AFFECT ACTUAL TRADING RESULTS.